


Before you can really dig into your content performance, you need a plan. Diving into a sea of metrics without knowing what you're looking for is a surefire way to get overwhelmed and come away with nothing useful. The whole point is to figure out what's working and what's not, and you can't do that without first defining what "working" actually means for your business.
A Practical Guide to Content Performance Analysis

Manage all your social media in one place with Postiz
+7 more
Laying the Groundwork for Smart Analysis
Honestly, the most important work happens before you even log into Postiz. Great analysis isn't about staring at every chart and graph available. It's about focusing on the metrics that matter. This means getting past the vanity metrics—the simple likes and views—and connecting your content directly to real-world business goals.
Connect Your Content to Business Goals
Every piece of content you publish should have a purpose. What job is it supposed to do? Are you trying to bring in better leads? Keep the customers you already have? Or maybe establish your brand as the go-to expert in your field?
Each of these goals changes how you look at your data.
For example, if lead generation is your main focus, you'll be obsessed with conversion rates from your social posts and the number of solid leads that came from a specific campaign. But if customer retention is the name of the game, you’ll be watching engagement in your private Facebook group or how many existing customers clicked links in your latest newsletter.
To get this right, you really need to get good at measuring marketing effectiveness. This is what separates creating content for the sake of it from creating content that genuinely moves the needle for your business.
Zero In on Your Key Performance Indicators
Once you know your goals, you can pick out the Key Performance Indicators (KPIs) that actually show you're making progress. It's tempting to track everything, but don't. Just pick a few key metrics that tell a coherent story.
Here's how I typically break it down:
- For Brand Awareness: I look at Reach, Impressions, and Share of Voice. This tells me how wide my net is being cast.
- For Engagement: It's all about Comments, Shares, and Saves. These actions show that people find the content genuinely valuable, not just scroll-past material.
- For Conversions: This is where the money is. I track Click-Through Rate (CTR), Form Submissions, and any Sales we can tie back to a specific post.
This isn’t just my opinion; it’s where the industry is heading. In 2025, 53% of marketers are focusing on social media and website engagement, and an impressive 63% report that their content is a direct driver of customer loyalty. The data shows a clear shift toward measuring real impact, not just visibility.
Set Up Your Postiz Dashboard to Match Your Goals
With your goals and KPIs locked in, the last step is to make your Postiz dashboard work for you. Customize your main view to put those important metrics front and center and filter out the rest of the noise.
I like to create separate reports for each major business goal. That way, I can see in a flash how our content is contributing to the big picture. This small bit of prep work turns Postiz from a data dump into a strategic tool for analyzing your content performance.
Finding Actionable Insights in Your Postiz Dashboard
Your Postiz dashboard is packed with data, but it’s not just a collection of numbers. Think of it as your command center for understanding what’s working and what’s not with your content. It’s easy to get lost in the weeds, so my advice is to always start broad before you dig deep.
The Overview dashboard is perfect for this. It gives you a quick health check by pulling together the combined metrics from all your connected social accounts. This is where you’ll spot the big-picture trends.
Maybe you see a huge engagement spike last Tuesday across all platforms. That's your cue to ask, "What did we post that day?" From there, you can jump into the specific reports for Instagram, Facebook, or LinkedIn to pinpoint the exact post that resonated.
Customizing Your View for Clearer Signals
The real magic happens when you filter out the noise and focus on the KPIs that actually matter to your goals. A comprehensive content performance analysis isn't about tracking every single metric; it's about tracking the right ones. This is where custom reports in Postiz become your best friend.
For instance, if your main objective is to boost brand awareness, you don't really need to obsess over link clicks. Instead, you can build a custom report that focuses only on:
- Reach
- Impressions
- Shares
This keeps you laser-focused on the metrics tied directly to your awareness goals, preventing you from getting sidetracked by vanity metrics.
Expert Tip: Data without context is just noise. The best insights come from asking specific questions and then using your dashboard to find the answers. Don't just stare at the numbers; look for the story they're telling about your audience.
Uncovering Real-World Patterns
Let's walk through a common scenario. A question I get all the time is, "Are my videos performing better than static images on Instagram?" With Postiz, you don't have to guess.
Simply head to your Instagram report, filter by content type (video vs. image), and compare their average engagement rates side-by-side. The answer will be right there in black and white, giving you clear direction for your content calendar.
Here’s a snapshot of what a customized dashboard might look like, giving you an at-a-glance comparison of your key social channels.
This kind of visualization instantly shows you which channels are your heavy hitters for engagement, helping you decide where to invest more time and budget.
Modern content performance analysis goes beyond just likes and shares. To get the full story, you need to look at a blend of metrics. Industry experts now recommend tracking at least eight essential metrics to understand true effectiveness, including time on page, social shares, and conversion rates. To go deeper, you can find great information about these essential metrics for 2025 on project-aeon.com.
To help you get started, here's a breakdown of the key metrics you should be tracking in Postiz.
Key Content Performance Metrics to Track in Postiz
This table outlines the essential metrics for a comprehensive content performance analysis, what they measure, and why they are important for your strategy.
| Metric | What It Measures | Why It Matters |
|---|---|---|
| Reach | The unique number of people who saw your content. | Shows the size of your potential audience and brand awareness. |
| Impressions | The total number of times your content was displayed. | Indicates how frequently your content is appearing in feeds. |
| Engagement Rate | The percentage of people who interacted with your post after seeing it. | Measures how compelling your content is to your audience. |
| Shares | The number of times your content was shared by users. | Highlights your most viral content and its word-of-mouth potential. |
| Link Clicks | The number of clicks on a link within your post. | Directly measures how effective your content is at driving traffic. |
| Conversion Rate | The percentage of users who completed a desired action (e.g., sign-up). | Connects your content directly to business goals like leads or sales. |
Tracking these will give you a well-rounded view of what's resonating and what's driving results.
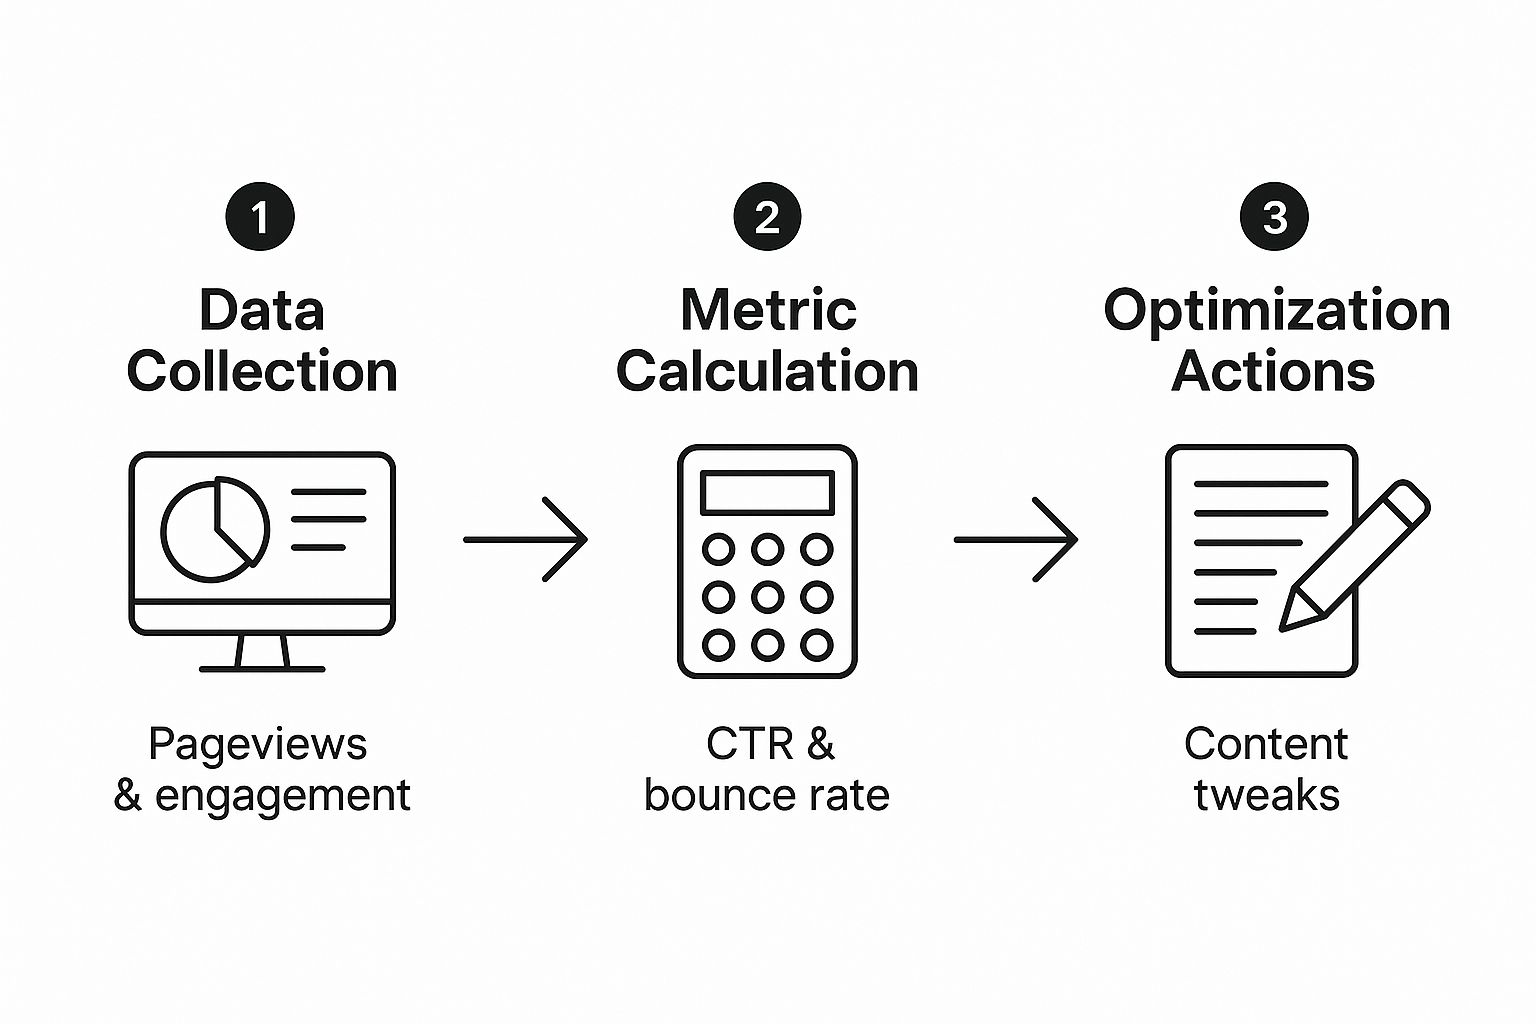
The key takeaway here is simple: data isn't the finish line. It's the starting point for making smarter decisions. By using your analytics to ask the right questions, you create a powerful feedback loop where every post informs the next. This is how you stop guessing and start building a content strategy that truly works.
Turning Performance Data Into a Smarter Content Strategy

Alright, so you've got all this data in your Postiz dashboard. What now? Numbers are just numbers until you use them to make smarter decisions. This is where the magic happens—where your content performance analysis stops being a report and becomes your roadmap for what to create next.
Think of it as a constant conversation with your audience. You post something, they react, and the data tells you exactly what they thought. You listen, learn, and adjust your approach for the next post. This simple loop is what separates a stagnant content strategy from one that's always getting better.
Finding Your Next Big Win in the Data
Once you start looking, you'll see patterns pop up everywhere. The trick is to connect the dots between a metric and a specific type of content. Don’t just stop at "this post did well." You have to dig in and ask why.
For instance, you might be scrolling through your Postiz dashboard and realize your posts that ask a direct question get 50% more comments than the ones that just make a statement. That’s not just a neat little statistic; it's a goldmine. It’s a clear signal from your audience that they want to interact. The next logical step? Plan a whole series of question-based posts to get that community conversation buzzing.
Here’s another common scenario: you see your Instagram Reels are killing it in terms of reach, but nobody is clicking the link in your bio. This tells you two things: the format is grabbing attention, but your call-to-action is falling flat. Your mission is now crystal clear—start testing new, stronger CTAs in your next few Reels to see if you can get those clicks up.
The real shift happens when you move from just observing to forming a hypothesis. Don't just say, "Our videos performed well." Instead, frame it like a theory: "I bet our audience engages more with short, educational videos because they're quick and offer instant value." Now you have something you can actually test.
From Insights to Action Items on Your Calendar
Once you've got a few of these data-backed ideas, it's time to get them on the content calendar. This is how you make sure your analysis actually changes what you create day-to-day.
Let’s translate a few common findings into real-world actions:
- Your infographics are share-magnets: If you see posts with charts and data get shared like crazy, make it a priority to create one high-quality infographic every month.
- LinkedIn text posts are a snooze-fest: Are your text-only updates on LinkedIn getting crickets? Time to shake things up. Try adding a simple graphic, launching a poll, or building a carousel to make people stop scrolling.
- Saturday mornings are your prime time: If your data consistently shows a huge engagement spike on the weekend, that's when you should be scheduling your most important content. Period.
This whole process takes the guesswork out of content creation. You're no longer just hoping something works; you're making choices based on what your audience has already shown you they like. If you want to dig deeper into setting up your views for this kind of analysis, this guide on building a social media analytics dashboard is a great place to start.
When you consistently analyze and adapt, you stop throwing content at the wall. You start building a deliberate strategy where every insight from your content performance analysis leads to a smarter, more effective post that actually delivers results.
Let AI Do the Heavy Lifting in Your Content Analysis
Let’s be honest, artificial intelligence gets thrown around a lot. But when it comes to analyzing your content's performance, it's not just hype—it’s a genuinely powerful tool that can give you a serious edge. Instead of just staring at numbers and guessing what worked, AI helps you understand why it worked and what you should do next.
Think of it as having a data scientist on your team. Inside Postiz, our AI is constantly working behind the scenes. It can spot a content trend just as it’s taking off, figure out the absolute best time for your specific audience to see your posts, and even help predict which content formats will be a hit next month. This is how you stop reacting to last week's data and start planning for next quarter's success.
Look Past the Numbers with AI-Powered Insights
One of the coolest things AI can do is make sense of all the human, qualitative feedback you get. I mean, who has time to read thousands of comments to get a feel for the room? Nobody. But an AI can perform sentiment analysis on all of them in a flash.
This feature quickly sorts comments into positive, negative, or neutral buckets, giving you an instant snapshot of how your audience is feeling. Did that new feature announcement land well, or did it just confuse everyone? AI gives you a clear, data-backed answer that goes way beyond a simple like count.
When you start analyzing how people feel about your content, not just what they do with it, everything changes. This emotional context is pure gold for refining your brand's voice and building a much stronger connection with your community.
A Real-World Example: Nailing Your Headlines with AI
Let's imagine you’ve just written a fantastic blog post but are completely stuck on the headline. Instead of just picking one and hoping for the best, you can use an AI tool to generate five different options.
- A headline that asks a direct question.
- A classic listicle-style headline.
- One that creates a bit of urgency or FOMO.
- A straightforward, benefit-focused headline.
- A creative one that sparks curiosity.
Now, you can use Postiz to share the post across your social channels, testing a different headline on each platform. A week later, you pop into your Postiz dashboard. The data will show you exactly which headline drove the most clicks and engagement. Just like that, you have a clear winner, plus valuable insight you can apply to every headline you write from now on.
This isn't some far-off future concept; integrating AI is quickly becoming the new standard in marketing. It's estimated that by 2025, over 80% of marketers will be using AI in some form. And the results speak for themselves. One study showed that only 21.5% of marketers using AI reported their strategies were underperforming, a significant drop from the 36.2% of their peers not using it. You can dig into more stats about AI's impact on content marketing here.
For those really looking to push the boundaries with predictive analytics and custom models, you might even consider the advantages of hiring data scientists and AI/ML engineers. By letting AI handle the grunt work of data analysis, you free up your own time to focus on the big-picture strategy and creative ideas—the stuff we humans are best at.
Communicating Your Findings to Stakeholders

You’ve done the hard work of digging through the data. Now comes the part that truly matters: sharing what you found. Even the most groundbreaking insights are worthless if they just sit in your dashboard. You have to translate those numbers into a clear, compelling story that everyone—from your manager to your clients—can understand and get behind.
Let's be honest, nobody wants a spreadsheet crammed with raw data. They want to know what it all means for the business. Your job is to connect the dots between your content's performance and their goals, proving the real-world value of your efforts.
Crafting a Narrative with Your Data
Think of your report as a story. Every good story has a beginning, a middle, and an end.
Start by quickly recapping the goals for the reporting period. This simple step immediately frames your analysis and reminds everyone what you were trying to achieve.
Next, you'll want to present the key data points that tell the story. Did a specific campaign lead to a surge in website traffic? Shout it from the rooftops. Did your video content pull in a 30% higher engagement rate than your static images? That’s a powerful insight that shapes future strategy.
Crucially, you need to wrap up with what’s next. Based on everything you’ve learned, what should the plan be for the coming month? When you propose clear, data-backed actions, you show you're not just looking in the rearview mirror—you're steering the ship. This turns a simple recap into a strategic roadmap.
The most persuasive reports I've ever built—or received—always boil down to three things: what we learned, why it matters, and what we're doing next. It's a simple framework that transforms a dry data review into a powerful tool for getting buy-in and proving ROI.
Using Postiz to Build Your Report
This is where Postiz really shines. Instead of getting bogged down in exporting CSV files and wrestling with spreadsheets, you can create clean, professional-looking reports right from the platform. The visual dashboards are practically made for stakeholder presentations.
The reporting feature in Postiz lets you grab the exact charts and graphs you need to showcase your wins visually. For example, you can easily pull together a snapshot of your monthly performance.
A visual like this instantly communicates your top-performing content, making it incredibly easy for anyone to see your successes at a glance.
A great report is focused and gets straight to the point. Here are a few tips I've learned for putting together a monthly summary that people will actually read:
- Lead with the wins. Kick things off with your most impressive results to grab their attention from the start.
- Show, don’t just tell. Use the charts from Postiz. Visuals make the data much easier to digest.
- Include lessons learned. Being open about what didn't work shows you're thinking critically and builds trust.
- Connect to business goals. Always tie your metrics back to what the business actually cares about, like leads, sales, or brand awareness.
By focusing on clarity and telling a strong story, your reports will do more than just inform. They’ll persuade your team, build confidence in your strategy, and prove the undeniable value of your work. If you want to get more granular, you can explore these essential content performance metrics to decide which numbers tell your best story.
Common Questions About Content Performance Analysis
When you start digging into your content performance, you’re bound to hit a few common questions. It happens to everyone. Getting clear on these points is what separates guessing from making truly strategic decisions backed by real data. Let's walk through some of the most frequent ones I hear.
How Often Should I Analyze My Content?
This is a big one, and there isn't a single right answer, but you can find a good rhythm. For a general pulse-check on your overall strategy, a monthly review is a great place to start. It’s enough time to see real trends emerge beyond the noise of daily ups and downs.
But if you’re running a specific campaign or trying out a new video format, you’ll want to check in more often. A weekly analysis is perfect for this. It gives you the agility to adjust your tactics quickly if something isn't landing with your audience.
The real goal is consistency. A quick 30-minute look at your numbers every week is far more powerful than a massive, overwhelming analysis you only do once a quarter. Keep it manageable.
What Is the Real Difference Between Reach and Impressions?
I see this all the time. It's a classic mix-up, but the difference is actually pretty simple and super important for understanding your data.
- Reach tells you how many unique people saw your post. Think of it as individual human beings.
- Impressions count the total number of times your content was shown on a screen. This number can include the same person seeing your post multiple times.
Let's say one of your followers sees your latest update in their feed in the morning and then again in the afternoon. That would count as 1 Reach and 2 Impressions. Seeing high impressions but lower reach might just mean a really engaged pocket of your audience is seeing your content repeatedly—which can be a great thing!
How Can I Measure the ROI of Top-Funnel Content?
This is the tricky one, right? Measuring the Return on Investment (ROI) for content that’s designed for awareness, like a blog post or an educational Reel, feels squishy because it doesn’t always link directly to a sale.
The secret is to focus on what I call "proxy metrics." These are the early signals that show you’re successfully guiding people down your marketing funnel.
Instead of looking for immediate sales, track these leading indicators:
- Newsletter Sign-ups: Did that helpful guide you posted lead to a jump in email subscribers?
- Follower Growth: Is your awareness content bringing in new people who fit your ideal customer profile?
- Branded Search Volume: Are more people typing your company’s name into Google after you launch a big campaign?
Connecting these softer conversions to your bigger goals tells the true story of your content's ROI. For a much deeper dive into this, our guide on social media analytics and reporting breaks down all the metrics you can use. When you track these early signs of interest, you can prove your content's value long before the final purchase happens.
Ready to stop guessing and start making data-driven decisions? The powerful analytics dashboards in Postiz turn complex numbers into clear, actionable insights. Sign up today and see exactly what's working with your content. Get started at https://postiz.com.

Founder of Postiz, on a mission to increase revenue for ambitious entrepreneurs
Do you want to grow your social media faster?

Do You Want to Grow Your Social Media Faster?
Thousands of creators and businesses use Postiz to 10x their social media reach. Stop spending hours — automate and grow.
🚀Schedule to all platforms at once
🤖Let AI write your posts for you
📈Watch your engagement skyrocket
💸Completely free to start
Related Posts

Transform your MCP social media approach with proven tactics that deliver real results. Learn how top agencies scale client platforms efficiently.

Discover the top 8 Pallyy alternatives and explore the ins and outs of this powerful social media management tool.

Find the perfect instagram grid maker to plan and schedule a stunning feed. We review the top 12 tools for visual planning, scheduling, and design.
Ready to get started?
Grow your social media presence with Postiz.
Schedule, analyze, and engage with your audience.

Open-source social media scheduling tool