


At its most basic, social media analytics reporting is all about taking the raw data from your social channels and turning it into a story you can actually understand. It’s the process of translating a mountain of numbers into clear insights that show you what’s hitting the mark with your audience and what’s falling flat. This isn't just about collecting data; it's about making sense of it.
Social Media Analytics Reporting That Drives Growth

Manage all your social media in one place with Postiz
+7 more
What Is Social Media Analytics Reporting, Really?
Imagine your social media strategy is a road trip. Your destination? Your business goals. Social media analytics reporting is your GPS. It tells you where you’ve been, exactly where you are right now, and the best route to get where you’re going. Without it, you're just driving in the dark, hoping you’re headed in the right direction.
This is what helps you move past the "vanity metrics"—things like likes and follower counts. Sure, they feel good, but they don't really tell you much about the health of your business. Real reporting goes much deeper to show you the true impact of your social media efforts.
From Data to Decisions
The magic of a good report is that it gives you the confidence to act. It’s not just a collection of charts and graphs; it's a tool that answers your most important business questions. A well-built report should point you in the right direction, helping your team make smarter decisions.
For example, a report might show that your videos on Facebook get tons of comments and shares, but your Instagram Reels are what actually drive people to your website. With that knowledge, you can tweak your strategy—using Facebook to build community and Instagram to drive sales. You're no longer guessing.
The goal of reporting isn't to create more reports. The goal is to create a single source of truth that helps you make fewer, but better, decisions with greater confidence.
The Core Components of a Report
So, what actually goes into a report that works? A solid social media analytics report rests on a few essential pillars. Each one gives you a different piece of the puzzle, and when you put them all together, you get the full picture of your performance.
Here’s a quick look at the core components that make up a strong report. Think of these as the non-negotiable elements that provide a complete, 360-degree view of your social media activities and their impact.
Table: Core Components of a Social Media Report
| Component | What It Reveals About Your Strategy |
|---|---|
| Performance Summary | Gives a quick, high-level overview of wins and key takeaways for busy stakeholders. |
| Key Performance Indicators (KPIs) | Shows exactly how you're tracking against specific goals like engagement or conversions. |
| Audience Analysis | Tells you who you're reaching and if they're the right people for your brand. |
| Content Breakdown | Pinpoints which posts and formats are working so you can understand why and do more of it. |
| Actionable Recommendations | Translates the data into clear next steps, turning insights into a concrete action plan. |
By including these pillars, you ensure your report isn’t just a data dump but a strategic tool. It becomes the bridge connecting what you do on social media every day to the results that truly matter for your business. It’s how you prove what’s working, fix what isn’t, and spot your next big opportunity for growth.
Tracking Metrics That Actually Matter
Great social media analytics reporting isn't about hoarding every number you can find. It's about knowing what those numbers are actually telling you about your business. Instead of a report card, think of your metrics as a diagnostic tool, with each number revealing a specific part of your performance story.
To get this right, you have to focus on the metrics that link your social media efforts to real business outcomes. The principles of mastering Key Performance Indicators are the same everywhere, regardless of your industry. The goal is always to find the signal in the noise.
Let's break the most important metrics down into three core groups. This simple framework will help you go from just collecting data to understanding what’s working, what isn't, and why.
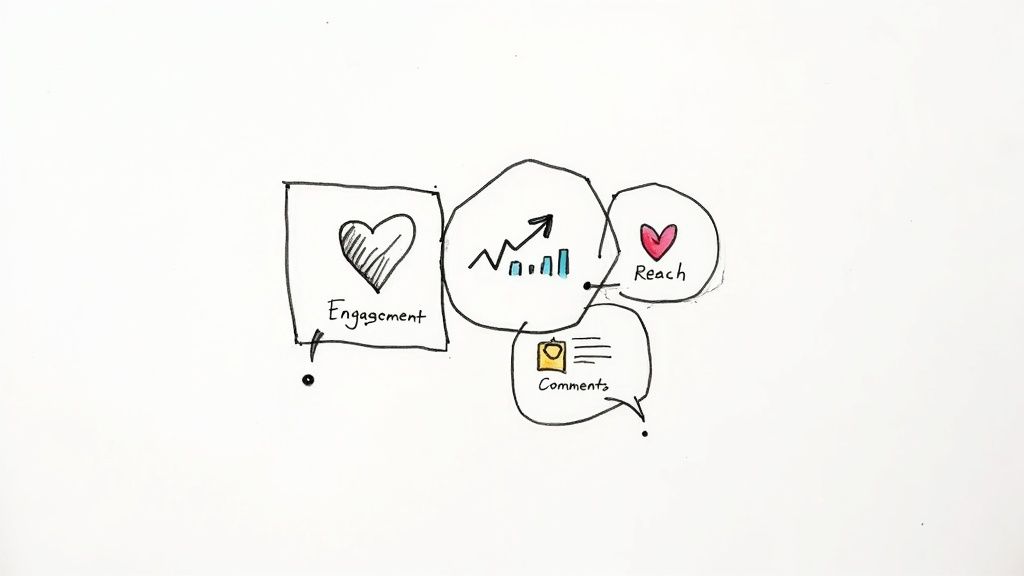
Awareness Metrics: How Far Does Your Message Travel?
This is your first checkpoint. Awareness metrics tell you how many people are seeing your content and how visible your brand is on a platform. Think of it like casting a net—how wide is it?
- Reach: The total number of unique people who saw your post. A high reach is a good sign that your content is cutting through the algorithm and landing in front of new eyes.
- Impressions: The total number of times your content was shown on a screen. If your impressions are way higher than your reach, it means your audience is seeing your posts multiple times, which can be fantastic for keeping your brand top-of-mind.
These numbers set the stage. If your reach is flatlining, it's a clear signal to rethink things like your hashtags, posting schedule, or even the type of content you're sharing. But a huge reach with no other results points to a completely different issue.
Engagement Metrics: Who Is Actually Listening?
This is where you find out if your message actually landed. Engagement metrics measure how people are interacting with your content. Are they just scrolling past, or are they stopping to react? This is the core of building a community and fostering loyalty.
Big awareness numbers are just vanity metrics if nobody cares enough to interact. The key engagement metrics to watch are:
- Likes, Comments, and Shares: These are the clearest signals that your content struck a chord. Shares are especially golden—they’re a direct endorsement from your audience to their own network.
- Engagement Rate: This percentage is your reality check. It tells you what portion of the people who saw your post actually engaged with it. A huge reach with a tiny engagement rate often means your content just isn't resonating.
It's easy to get excited about high impressions, but if they don't lead to interactions, your content is just wallpaper. It's there, but nobody's really looking at it.
If your engagement is low, it's time to get honest about your content strategy. Are your visuals compelling? Is the copy interesting? Are you asking questions to spark a conversation? Digging into specific https://postiz.com/blog/social-media-engagement-metrics can give you a much clearer picture of what works.
Conversion Metrics: Who Is Taking Action?
Here’s where the rubber meets the road. Conversion metrics connect your social media activity directly to tangible business results, like sales or leads. This is how you prove your ROI.
- Click-Through Rate (CTR): This is the percentage of people who not only saw your post but also clicked the link in it. A strong CTR means your call-to-action (CTA) and your offer were compelling enough to make someone act.
- Conversion Rate: This tracks the percentage of users who clicked your link and then took the final step, like buying a product or filling out a form on your site. For many campaigns, this is the ultimate measure of success.
The real magic happens when you look at these metrics together. For instance, tons of engagement but a low CTR might mean your audience loves your brand but your CTA is weak or confusing. On the flip side, a high CTR but a low conversion rate could point to a problem with your website or landing page.
By understanding how these numbers relate to each other, your social media analytics reporting becomes less of a chore and more of a powerful roadmap for real growth.
How to Build Your First Actionable Report
Diving into social media reporting for the first time can feel overwhelming. There's so much data, and it's easy to get lost. The trick is to start simple. Think of it less like a complex scientific study and more like creating a straightforward, repeatable recipe you can improve over time.
It all starts with a simple question, and it's not about data: "What are we actually trying to do here?" Before you even glance at a metric, you have to connect your reporting efforts to your bigger business goals. Are you trying to get your brand name out there? Drive traffic to your website? Find new customers? Your answer is the foundation for everything that follows.
This initial step gives your report a clear purpose. Instead of drowning in numbers, you'll be on a mission, looking for specific clues that tell you if your strategy is actually working.
Step 1: Start With Your Business Goals
Everything you do should flow directly from your objectives. A report without a goal is just a bunch of numbers without a story. So, start by defining what a "win" looks like for your business over the next month or quarter.
- Goal: Increase brand awareness.
- Goal: Drive more qualified leads through social media.
- Goal: Build a more engaged community around your brand.
It's tempting to track everything, but don't. Pick one or two main goals to focus on. This keeps your report clean and pointed, making it much easier to pull out clear, meaningful insights.
Step 2: Select Your Key Performance Indicators
With your goals locked in, it’s time to pick the Key Performance Indicators (KPIs) that will show you whether you're succeeding. Each KPI needs to tie directly back to one of your goals. This is what makes social media analytics reporting truly useful.
Let's see how this works with the goals we just set:
| Business Goal | Corresponding KPIs to Track |
|---|---|
| Increase Brand Awareness | Reach, Impressions, Follower Growth Rate |
| Drive Qualified Leads | Click-Through Rate (CTR), Website Clicks, Conversion Rate |
| Build an Engaged Community | Engagement Rate, Comments, Shares, Brand Mentions |
By focusing only on the metrics that matter for your goals, you sidestep the trap of vanity metrics and concentrate on data that actually moves the needle.
Step 3: Gather Your Data and Visualize It
Okay, now it's time to wrangle the data. You can get this information straight from each platform's built-in tools (like Facebook Insights or Instagram Insights) or use a central hub like Postiz to pull it all into one dashboard.
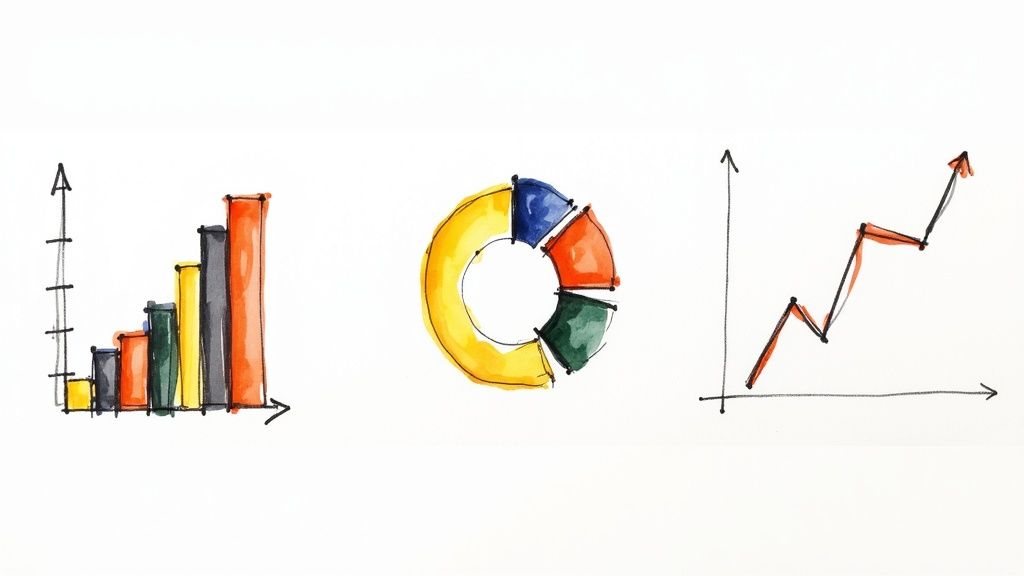
This is where visuals become your best friend. A spreadsheet full of raw numbers is tough to make sense of, but a good chart can make a trend pop instantly. If you need some inspiration, check out these examples of effective sales dashboards that do a great job of highlighting what’s important for growth.
Present your KPIs in a clean, visual way:
- Line charts are perfect for showing changes over time, like your follower growth.
- Bar graphs are excellent for comparing things, like engagement on video posts versus image posts.
- Pie charts work well for breaking down your audience by age or location.
This infographic shows some of the conceptual tools needed for choosing the right analytics platforms.
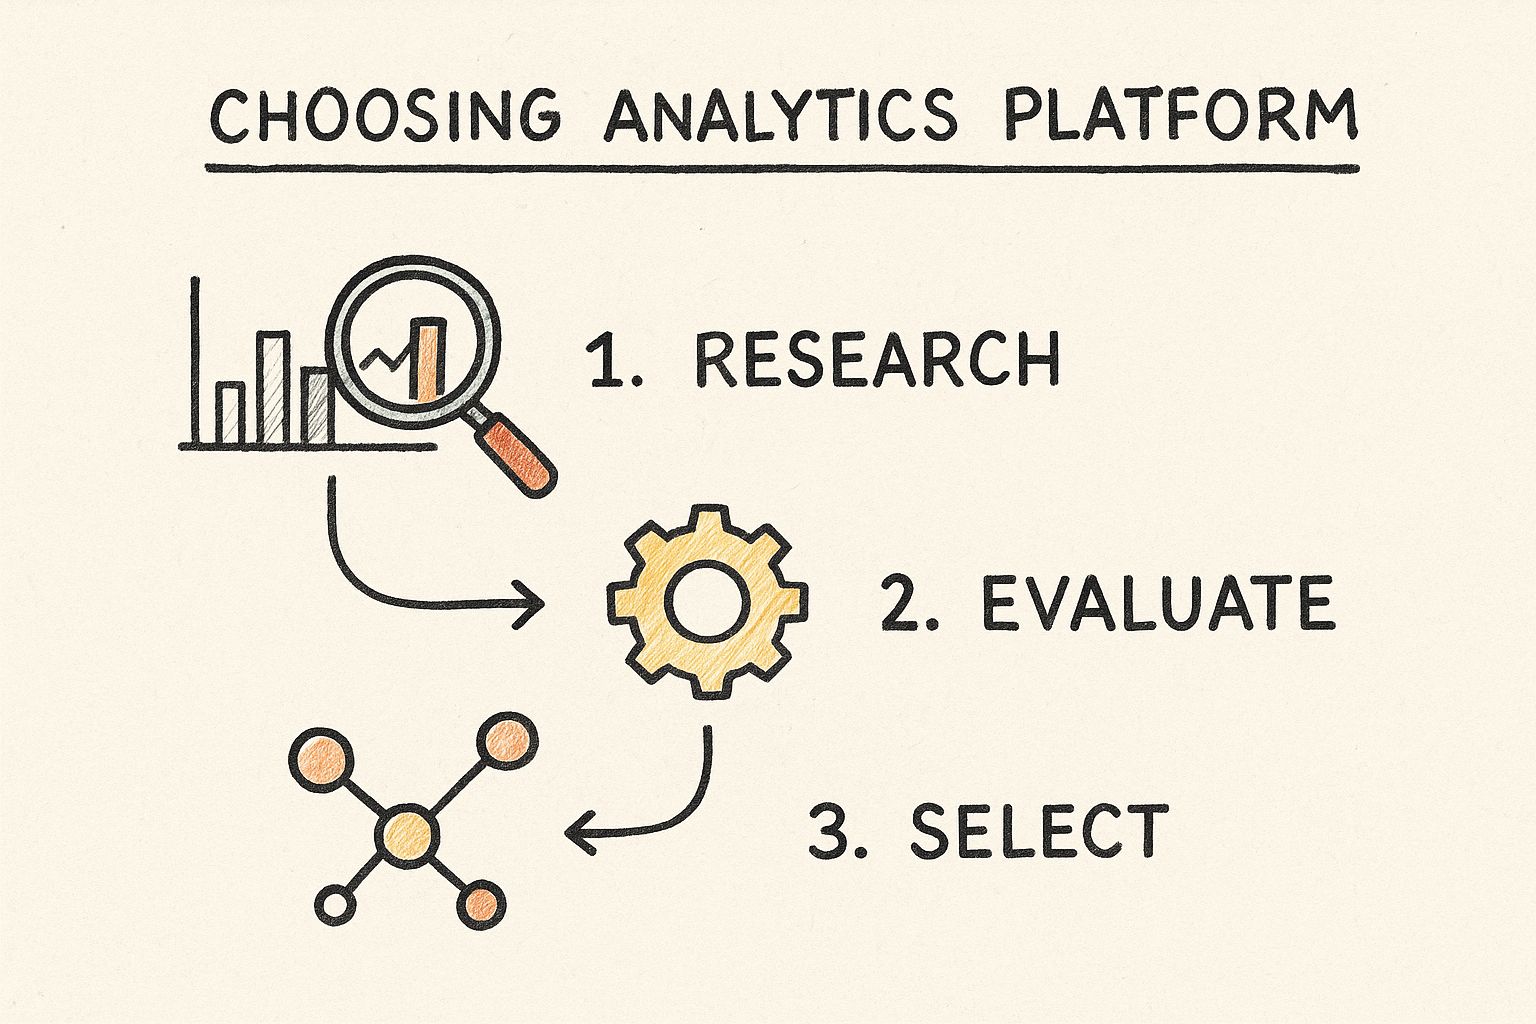
As the image suggests, the best tools let you dig deep, configure your view, and connect the dots between all your different social platforms.
Step 4: Add Context and Recommendations
This last step is what turns a simple data summary into a strategic report. This is where your human expertise shines. For every key piece of data, you have to answer two simple but powerful questions: "So what?" and "Now what?"
A great report doesn't just present data; it interprets it. It tells the story behind the numbers and provides a clear path forward for the team.
Don't just say, "Engagement was down 10%." Dig deeper and explain why. For example: "Our engagement rate dropped by 10% this month. This lines up with our switch from video content to static images. To get this number back up, I recommend we add two short-form videos back into the content schedule next week."
This simple shift in approach takes your report from being a passive document to an active tool that guides your strategy and helps you grow.
Choosing Your Social Media Reporting Tools
https://www.youtube.com/embed/j9tyQX9AWmg
Picking the right tool for social media reporting can feel a bit like choosing between a handful of city maps and a fully integrated GPS. Both can get you where you’re going, but one gives you the full picture in real-time while the other requires you to piece things together yourself. Your choice here will directly impact how you collect data, how much time you burn doing it, and ultimately, the story your numbers can tell.
The most common starting point for just about everyone is the collection of free, native analytics tools built right into each social media platform. I'm talking about Facebook Page Insights, Instagram Insights, LinkedIn Analytics, and the like. They’re fantastic for a quick, no-nonsense look at how your content is doing on that specific channel. They're simple, cost nothing, and give you all the basic metrics you need to get started.
But here’s the catch: their biggest strength is also their main weakness. Native tools live in their own little worlds. If you’re managing accounts on three different networks, you're logging into three separate platforms, pulling three different reports, and then trying to stitch it all together in a spreadsheet. It’s not just tedious; it makes it nearly impossible to see how your entire social media effort is performing as a whole.
Beyond Native Tools with Dedicated Platforms
This is exactly where dedicated, third-party reporting platforms come in. Think of tools like Sprout Social, Hootsuite, or our own Postiz. They act as a central hub, pulling all your social media data into one place. Instead of juggling a dozen tabs and spreadsheets, these tools automatically gather everything into a single, unified dashboard.
This consolidation saves a massive amount of time and cuts down on the chance of human error. But the real magic goes beyond just convenience. These tools unlock advanced features that native analytics simply don't offer.
- Competitor Tracking: Finally, you can see how you measure up against your biggest rivals.
- Sentiment Analysis: Go beyond likes and comments to understand the feeling behind the conversations.
- Automated Reporting: Set it and forget it. Have reports sent straight to your inbox on a schedule.
- Customizable Dashboards: Cut through the noise and build a view that shows only the metrics that matter to your goals.
Investing in a dedicated tool is the difference between looking at individual puzzle pieces and seeing the finished picture. You're no longer just analyzing isolated posts; you're understanding the entire ecosystem and how everything works together to drive results.
Making the Right Choice for Your Team
So, which path is right for you? The honest answer is: it depends. The decision between native tools and a dedicated platform boils down to your team’s specific needs, budget, and goals. There’s no single "best" choice for everyone.
What's clear is that the demand for better data is exploding. The global social media analytics market is on track to hit an astounding USD 43.25 billion by 2030. This incredible growth shows just how vital real-time data has become for businesses to keep up.
To help you decide, here’s a quick breakdown:
| Consideration | Native Analytics Tools | Dedicated Third-Party Tools |
|---|---|---|
| Cost | Free | Paid subscription |
| Best For | Small teams, single-platform focus, basic reporting | Multi-platform strategies, agencies, in-depth analysis |
| Time Investment | High (manual data pulling) | Low (automated data gathering) |
| Key Features | Core metrics (reach, engagement) | Advanced analytics, competitor tracking, automation |
For a more detailed look at your options, check out our guide on social media reporting tools to find a solution that simplifies your workflow and delivers the powerful insights you need to grow.
Best Practices For Reporting That Gets Results
A great report does more than just throw numbers on a page; it tells a story, sparks action, and proves your worth. This is where all your hard work on social media pays off, turning your efforts into a solid business case. But to get it right, you have to move beyond just dumping data. It takes context, smart visuals, and a real understanding of who you're talking to.
These best practices will help you turn your social media analytics reporting from just another task into a powerful strategic tool. The real goal is to create reports that people actually talk about and use to make smarter business decisions.
Tailor The Story To The Audience
Let's be honest: not everyone cares about every single metric. A report that gets your content team excited will probably put your CEO to sleep. The secret to effective reporting is giving each person exactly what they need to see.
- For Your CEO or Leadership: They want the 30,000-foot view, and they want it fast. Stick to high-level ROI, business impact, and how you’re tracking against the big company goals. Show them how social media is helping the bottom line.
- For Your Marketing Manager: They need a blend of strategy and performance. This is where you connect campaigns to KPIs and highlight key takeaways that will shape the next marketing push.
- For Your Content Team: Now you can get into the nitty-gritty. This team needs to know which posts, formats, and topics are hitting the mark so they can make more of what works. Data on top-performing content is gold for them.
When you customize the focus, your report lands with much more impact because it speaks directly to what each person is measured on.
A report is only as good as the action it inspires. The best ones tell the right story to the right people, making the data impossible to ignore.
Go Beyond Numbers With Context And Analysis
This is what separates the pros from the amateurs. Don’t just show the numbers; explain what they actually mean. Your job isn’t just to collect data; it's to be the expert who interprets it. For every chart or metric, you need to answer the most important question: "So what?"
Instead of just saying, "Our reach went up 20%," give it a story. Try this: "Our reach jumped by 20% this month right after we started posting short-form videos twice a week. This strongly suggests the new format is helping us connect with a wider audience on Instagram."
See the difference? That narrative turns a simple data point into a clear cause-and-effect insight. It shows you’re thinking strategically and makes it way easier to get a "yes" for your next idea.
Set A Consistent Reporting Cadence
When it comes to tracking performance, consistency is everything. Whether you report weekly, monthly, or quarterly, sticking to a regular schedule helps you build a reliable history of data. This is how you spot long-term trends, account for seasonality, and accurately measure how your strategies are paying off over time.
This rhythm also builds trust with your higher-ups. When they know when to expect your report, it becomes a dependable part of their routine and a constant reminder of the value your team brings.
Use Data Visualization To Tell The Story
Our brains process images way faster than text, so use that to your advantage. Clean, simple charts and graphs can make your findings crystal clear at a glance.
This need for clear insights is a huge reason the social media analytics market, valued at USD 13.47 billion in 2024, is projected to hit USD 61.95 billion by 2032. Businesses are investing heavily in tools that can visualize complex data. You can find more details on this trend and key market players on fortunebusinessinsights.com.
Use line graphs to show trends, bar charts for comparisons, and pie charts to break down audience demographics. A single, well-designed visual can deliver a key insight in seconds, making your entire report more engaging and your message unforgettable.
Common Reporting Questions Answered
Even with the best strategy laid out, you're always going to bump into practical questions when you start digging into social media analytics reporting. It just comes with the territory. This section is here to clear up some of the most common ones I hear all the time. Think of it as a quick FAQ to help you get past those little roadblocks.
Getting these details right is what separates a report that gets filed away from one that actually drives decisions. Let's make sure your hard work pays off.
How Often Should I Run Social Media Reports?
There’s no magic number here. The right answer really depends on what you’re trying to achieve and who’s reading the report. You need to match the timing to the goal.
-
Weekly Reports: Think of these as your tactical check-ins. They’re perfect for keeping a close eye on an active campaign. A quick weekly look lets you spot what’s working and what isn’t, so you can make adjustments on the fly before a small issue snowballs.
-
Monthly Reports: This is the sweet spot for most teams and what I’d consider the standard. A month gives you enough data to see real trends emerge without getting bogged down by daily noise. It's the best way to track progress against your main goals and keep everyone on the same page.
-
Quarterly Reports: These are for the big-picture view, usually for leadership or executives. Quarterly reports should zoom out and focus on long-term growth, overall business impact, and, of course, the return on your investment (ROI).
Whatever you choose, the most important thing is to be consistent. A regular report creates a performance history, and that historical data is what makes your insights truly powerful over time.
What Is The Difference Between Analytics And Reporting?
People often use these words interchangeably, but they’re two very different—and equally important—parts of the same process. Getting the distinction clear in your head will make your entire workflow much smoother.
Analytics is the investigation. It’s you, the detective, digging through all the raw data to find clues, patterns, and the "why" behind what happened. Reporting is the storytelling. It’s you presenting your case to the jury, organizing those findings into a clear, compelling narrative that makes sense to everyone else.
You can't have one without the other. Great analytics are useless if you can't communicate them clearly, and a beautiful report is just fluff without solid analytical work to back it up.
How Do I Prove Social Media ROI In My Reports?
This is the big one, isn't it? Connecting social media efforts to actual revenue is the ultimate goal, and it's totally possible if you set things up correctly. You just need to draw a straight line from your posts and ads to real business results, like sales and leads.
Here’s how you get it done:
-
Get Your Tracking in Place: First things first, you absolutely need tracking pixels (like the Meta Pixel or TikTok Pixel) installed on your website. This is non-negotiable. It’s how you’ll know if someone who saw your social content actually did something on your site.
-
Use UTM Parameters: Tag all the links you share on social media with custom UTM codes. This is like leaving a trail of breadcrumbs. Tools like Google Analytics can then tell you exactly which platform, campaign, or even which specific post sent traffic and sales your way.
-
Focus on Conversion Metrics: In your ROI reports, shift the spotlight from vanity metrics to the numbers that really matter: leads generated, form submissions, items added to carts, and completed purchases. These are the metrics that speak the language of business.
-
Assign a Dollar Value: Work with your sales or finance teams to figure out what a conversion is worth. For example, maybe every new lead is worth an average of $50. Once you have that number, you can calculate the direct financial return from your social media campaigns.
Following these steps will change your report from a simple activity summary into a document that proves real financial impact. If you want to go even deeper on this, our guide on how to measure social media success has even more detail on connecting your work to the bottom line.
Ready to transform your data into actionable insights? With Postiz, you can consolidate your analytics, automate your reports, and spend less time pulling numbers and more time driving growth. Start streamlining your social media analytics reporting today.

Founder of Postiz, on a mission to increase revenue for ambitious entrepreneurs
Do you want to grow your social media faster?

Do You Want to Grow Your Social Media Faster?
Thousands of creators and businesses use Postiz to 10x their social media reach. Stop spending hours — automate and grow.
🚀Schedule to all platforms at once
🤖Let AI write your posts for you
📈Watch your engagement skyrocket
💸Completely free to start
Related Posts

Discover how a social media analytics dashboard can help you analyze data, track metrics, and optimize your social strategy effectively.

Learn how chiropractors can use social media to attract local patients, build trust, stay HIPAA-compliant, and turn engagement into appointments.

Struggling to comment? Discover top Instagram comment ideas to spark conversations, build community, & boost engagement. Includes examples & tips.
Ready to get started?
Grow your social media presence with Postiz.
Schedule, analyze, and engage with your audience.

Open-source social media scheduling tool