Let's be honest: measuring social media success can feel like trying to nail Jell-O to a wall. If you're struggling to show how your hard work on social media actually helps the business, you're not alone. It's easy to get caught up in the vanity game of likes and follower counts, but those numbers rarely tell the whole story.
The real trick is to connect your social media activities directly to tangible business objectives. Imagine if you could prove that your social posts led to a 10% increase in sales. That's when social media stops being a guessing game and becomes a reliable engine for growth.
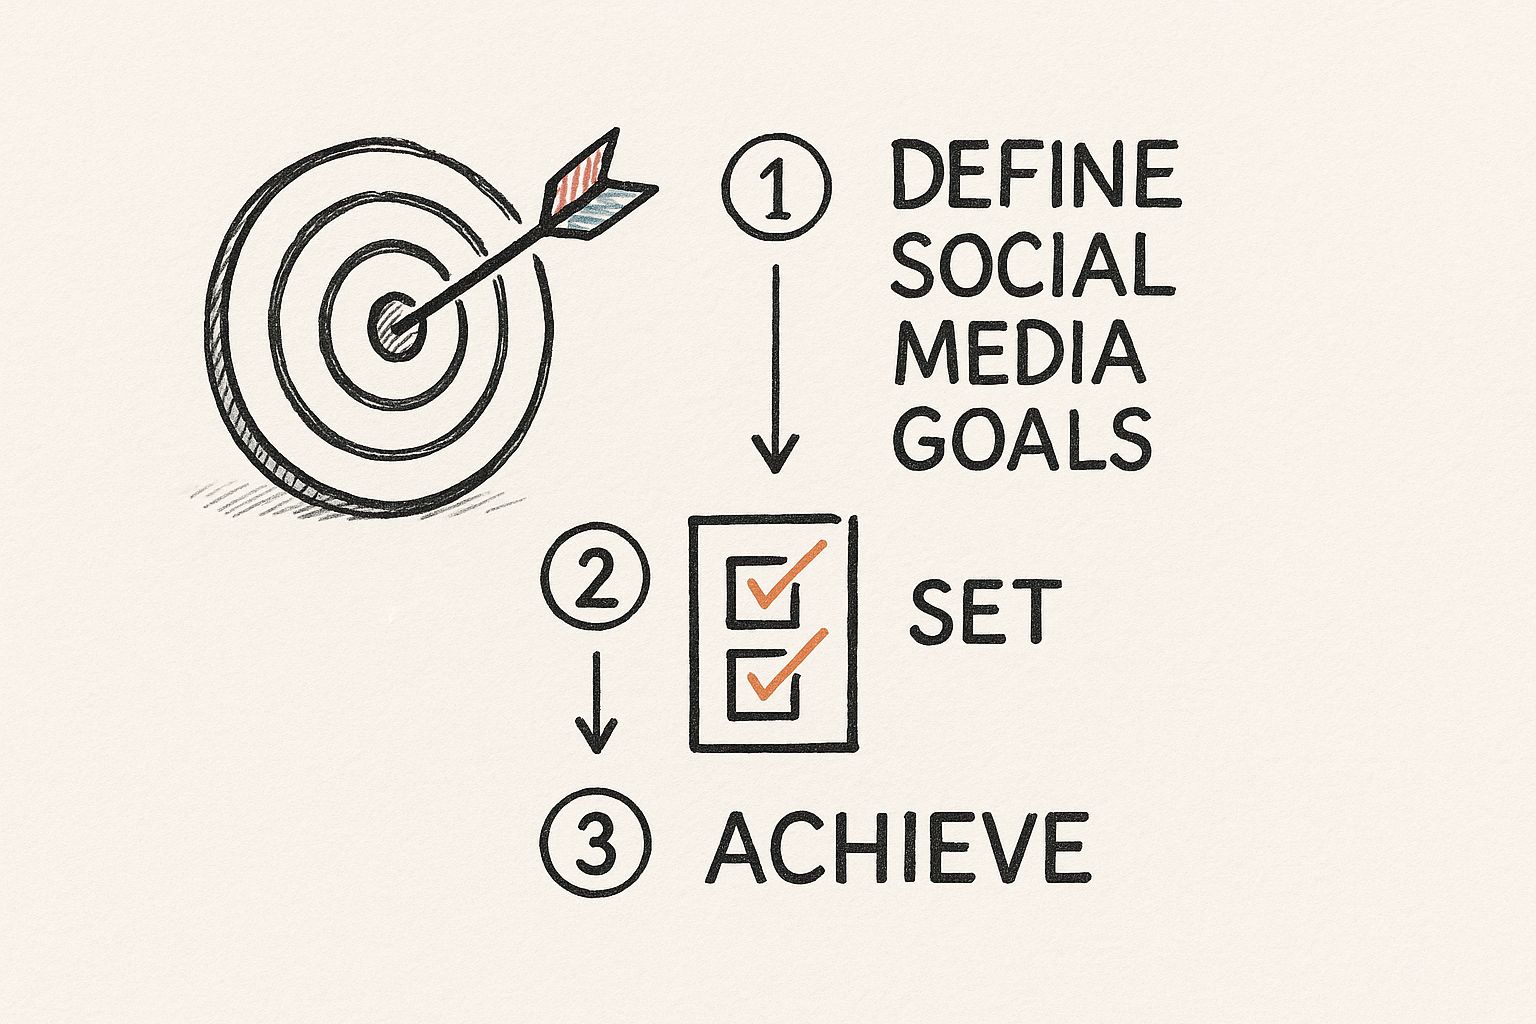
So, how do we get there? It starts with a simple but powerful shift in mindset.
Manage all your social media in one place with Postiz
The first step is to stop asking, "How many likes did we get?" and start asking, "What business goal did this post actually help us achieve?" This small change frames everything differently. It forces you to think about impact over impressions.
Real success isn't about looking busy; it's about contributing to the bottom line.
What Does Success Really Look Like for Your Business?
Before you even think about opening an analytics report, you need to get crystal clear on what you're trying to accomplish. Every business is different, so your definition of "success" will be unique to you.
What are you trying to do on social media? Most goals fall into a few common buckets:
Boost Brand Awareness: Getting your name in front of people who've never heard of you.
Drive Website Traffic: Funneling users from social platforms directly to your website, whether it's a blog post or a product page.
Generate Qualified Leads: Collecting contact info from people genuinely interested in what you offer.
Increase Sales and Revenue: Tying purchases directly back to your social media efforts.
Think about a local bakery. Their main goal isn't to get thousands of likes from people across the country. Success for them is seeing a flood of new faces in the shop, all saying, "I saw your amazing croissant video on Instagram!"
A hard-earned lesson: You can't measure what you haven't defined. A vague goal like "improve engagement" is impossible to track. A specific, actionable goal like, "Increase our average post engagement rate by 15% in Q2," gives you a clear target to aim for.
Getting to Know the Core Metric Categories
Once your goals are locked in, you can pick the right Key Performance Indicators (KPIs) to track your progress. These are the specific data points that will tell the story of whether your strategy is working or not.
These metrics usually fall into a few key categories. Understanding them helps you build a dashboard that gives you a complete picture of your performance.
Let’s take a look at the foundational metrics you should know. This table gives you a quick rundown of what they are and why they matter.
Core Metrics for Measuring Social Media Success
Metric Category
Key Metrics
What It Measures
Awareness
Reach, Impressions, Audience Growth Rate
The size and growth of your potential audience. How many unique people see your content?
Engagement
Likes, Comments, Shares, Clicks, Saves
How audiences are interacting with your content. Are they actively participating?
Conversion
Conversion Rate, Cost-Per-Conversion, Leads
The effectiveness of your social media in driving desired actions, like sign-ups or sales.
Customer Loyalty
Customer Testimonials, Reviews, Brand Mentions
The sentiment and satisfaction of your existing audience and customers.
This table is just your starting point. The key is to select the metrics that align directly with the specific business goals you defined earlier.
With your goals and KPIs established, you're ready to start using analytics tools like Postiz to gather the data you need. This structured approach is how you transform your social media from a content-publishing machine into a powerful tool for business growth.
Connecting Social KPIs to Business Goals
Before you even think about opening an analytics dashboard, you need to answer a fundamental question: what are we actually trying to achieve here? Measuring social media performance without a clear purpose is like sailing without a compass. You’re moving, sure, but you have no idea if you’re heading in the right direction.
Every action on social media should tie back directly to your core business objectives. Are you trying to get your name out there (brand awareness)? Funnel people to your website? Find new customers? Boost sales? Each of these goals requires a completely different yardstick for success.
The real trick is drawing a straight line from your big-picture business goals to the specific social media numbers that prove you’re making a difference.
From Business Goal to Social KPI
Let’s get practical. If you run an e-commerce shop, your main goal is probably sales. In that case, you shouldn't get too hung up on vanity metrics like 'likes'. Instead, you need to focus on what actually moves the needle.
Add to Cart from social ads: How many people are putting products in their cart after clicking an ad?
Social media conversion rates: What percentage of website visitors from social media actually make a purchase?
Return on ad spend (ROAS): For every dollar you spend on ads, how much revenue are you getting back?
These are the KPIs that show social media is directly contributing to your bottom line.
Now, flip the script. Imagine you’re a B2B company that needs to generate high-quality leads for its sales team. Your measurement strategy would look totally different. You'd be tracking things like:
Marketing Qualified Leads (MQLs) from LinkedIn
Demo requests originating from X (formerly Twitter)
Click-through rates on your latest case study links
These metrics prove that your social media efforts are filling the sales pipeline. Even small things, like having a clear and compelling channel description, can contribute. If you need some ideas, this YouTube bio generator can spark some inspiration.
The bottom line is this: when you connect every social media metric to a tangible business outcome, you stop reporting on numbers and start telling a powerful story about impact and ROI. Suddenly, justifying your budget and proving your strategic value gets a whole lot easier.
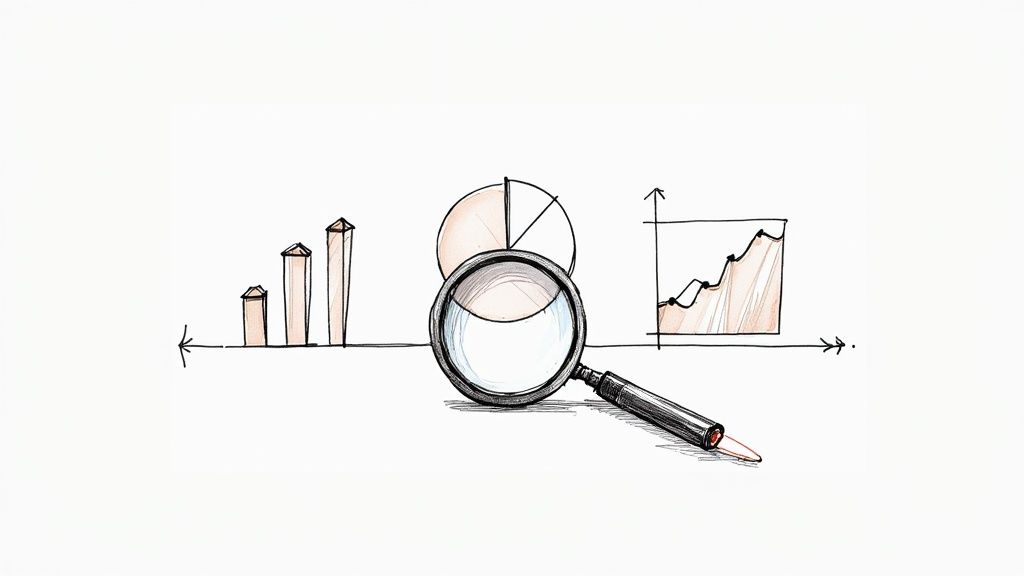
This visual really nails the process, showing how you can distill broad business objectives into the nitty-gritty KPIs you'll track every day.
As you can see, it's a funnel. You start with the big, high-level goals and narrow them down into specific, actionable metrics for each social channel.
Making Data-Driven Strategic Decisions
Once you have this framework in place, your data becomes more than just a report card—it becomes a roadmap. To really get an edge, you need to embrace data-informed decision making. This means using your KPIs to guide what you do next.
Let's say your goal is brand awareness, and you notice that your video posts consistently get far higher impressions and reach than your static image posts. The data isn't just telling you what worked; it's screaming at you to invest more time and resources into creating video content. It’s all about letting the numbers guide your strategy.
Choosing the Right KPIs for Each Platform
Here’s a hard truth about social media: treating all your channels the same is a recipe for frustration. A viral moment on TikTok feels completely different from a high-impact post on LinkedIn for a reason—the audiences, algorithms, and expectations are worlds apart.
If you want to genuinely measure your success, you have to ditch the one-size-fits-all scorecard. A "like" just isn't a "like" across the board. On Instagram, it’s often a passive nod of approval. But a Save? That’s a user telling you your content is valuable enough to come back to later. It's a much stronger signal. Likewise, a Share on LinkedIn carries real weight; it means a professional is endorsing your content to their entire network.
How to Match Your Metrics to the Platform
So, how do you stop chasing the wrong numbers? You start by understanding what “good” actually looks like on each channel. A stellar engagement rate on one platform might be just average on another.
For instance, looking at engagement rate—how many people interact with your content relative to your audience size—is incredibly revealing. Recent benchmarks put TikTok way out in front with an average engagement rate of 2.50%. To put that in perspective, Facebook and X (formerly Twitter) are both sitting at around 0.15%. Knowing this context is crucial.
Let’s break down which KPIs really matter, and where.
Instagram & Facebook: It's time to look past the vanity metrics. Start focusing on Saves, Shares, and the sentiment of your Comments. These tell you about content quality and the health of your community. When it comes to Stories, the Reply Rate and Completion Rate show you who’s actually tuned in.
TikTok: This platform's algorithm is all about holding attention. Your most important metrics here are Average Watch Time and Video Completion Rate. When these numbers are high, you're signaling to TikTok that your content is sticky, which can earn you a huge boost in organic reach.
LinkedIn: This is the professional arena, so your metrics should reflect business value. Track Shares, Comments from people in your target roles, and especially Website Clicks leading to your blog or careers page. These are the KPIs that prove you’re a thought leader and are driving meaningful action.
Think Like a User
You have to get inside the user's head. Why are they on that specific app at that specific moment? People jump on TikTok for a quick dose of entertainment, so short, trendy, and high-energy content wins. Your metrics should reflect that fast-paced consumption.
Then you have platforms like Reddit, where users are often digging for deep information or looking for a real discussion within a community. Success isn't just about upvotes; it's about the quality and depth of the comment threads you generate. If you're building a presence on a niche community site, using something like a Reddit post generator can help you create posts that hit the right tone from the very beginning.
Key Takeaway: The smartest way to measure social media is to match your KPIs to the user's mindset on each platform. Don't just count the interactions; analyze the quality and intent behind them. This is how you gain the clarity to make real improvements and prove your impact.
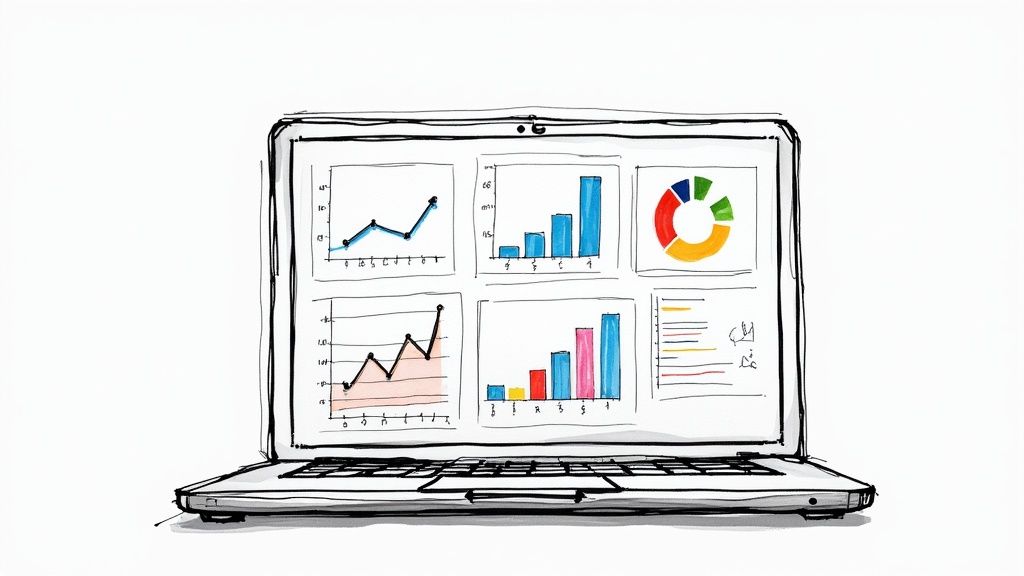
Making Sense of Your Social Media Analytics
Having all that raw data from your social media channels is one thing. Knowing how to read the story those numbers are telling you? That's where the real magic happens. Just looking at data without any context can be seriously misleading, so you have to dig a little deeper to understand what’s actually going on.
For example, you might see a post hit 100,000 impressions and get that little rush of excitement. But hold on. If that same post only got a handful of clicks or a few half-hearted comments, it's not the win you think it is. It's a flashing neon sign pointing to a disconnect. Your content got in front of a lot of eyeballs, but it didn't connect enough to make anyone do anything.
This is where you need to get good at interpreting the data. It's about looking at the hard numbers (the quantitative stuff, like reach and clicks) alongside the human feedback (the qualitative stuff, like what people are saying in the comments).
The Story Behind the Numbers
To really get what's working, you have to pair up different metrics to see the full picture. I always tell people to start by looking at impressions right next to engagement. A post with sky-high impressions but low interactions means your content isn't hitting the mark. It’s like shouting into a packed room where nobody’s actually listening. Tracking both gives you a much richer view of whether your audience is truly participating or just scrolling by. For a deeper dive into which metrics matter most, this guide on social media metrics is a fantastic resource.
Video is another area where the numbers can fool you. Simple view counts are probably one of the most deceptive metrics out there. A "view" can be counted after just a few seconds, which tells you almost nothing.
My advice? Forget initial video views. Focus all your attention on Average Watch Time and Video Completion Rate. These two numbers tell you who is genuinely hooked. A high completion rate is a powerful signal that your content was compelling enough to keep someone watching all the way through.
Turning Insights into Action
Reading your analytics isn't just a reporting task; it's about gathering intel to make smarter moves next time. As you look through your data, you should be hunting for patterns that answer some key questions.
Which post types get shared the most? If you see your behind-the-scenes carousels are getting way more shares than anything else, that’s your audience shouting what they want from you.
What topics get people talking? Read the comments. Are people asking thoughtful questions or just leaving a fire emoji? Are they sharing their own stories? This is a goldmine for your next batch of content ideas.
When are my best followers actually online? Every platform gives you this data. Tweaking your posting schedule to hit those peak times is one of the easiest wins you can get for more visibility and interaction.
By asking these kinds of questions, you stop being a data reporter and start becoming a strategist. This is how you create content that doesn't just reach people, but actually connects with them.
How to Benchmark Performance and Optimize Your Strategy
So, you're looking at your latest report and see an engagement rate of 1.5%. What does that even mean? Is it good? Bad? Just… okay? Without any context, your data is just a pile of numbers.
To figure out if you're actually winning at social media, you need to benchmark your results. This is how you turn raw data into a real strategic advantage, showing you not just what happened, but how well you’re truly doing compared to the rest of the world.
A great starting point is looking at industry-wide trends. It gives you a much-needed reality check. For instance, if you've noticed your engagement has been slipping, it helps to know you're not alone. Recent reports analyzing millions of posts found that engagement dropped 36% on Facebook and a massive 48% on X. Knowing this helps you set realistic goals and judge your own performance fairly. You can discover more industry engagement insights in this 2024 report.
Use Your Own History as a Guide
While industry data is valuable, your most important benchmark is your own past performance. Honestly, your biggest competitor should always be your past self.
A simple year-over-year (YoY) analysis is one of the most powerful ways to see how far you've come. Just compare your performance in Q2 of this year to Q2 of last year. Are your clicks up? Has your reach expanded? This straightforward comparison filters out the noise from seasonal changes and reveals your true growth trajectory. It helps you answer the most important question of all: "Are we doing better than we were before?"
Pro Tip: Don't just glance at the top-line numbers. Dig deeper into specific content types. Maybe your year-over-year video views skyrocketed by 50%, but your carousel posts are completely flat. That’s a crystal-clear signal from your audience telling you exactly where to put your creative energy.
Turn Your Insights Into Action
Benchmarking isn't just about giving yourself a report card. It's about building a smarter plan for the future. Once you have that context, you can start making real, targeted improvements to your strategy. This is the moment you shift from simply measuring success to actively creating it.
Your data should kickstart a constant cycle of testing, learning, and refining.
A/B Test Your Content: If your click-through rates are disappointingly low, start testing different calls-to-action (CTAs). Pit "Shop Now" against "Learn More." Try posing a question in your caption instead of just making a statement. You'd be surprised how much these small tweaks can matter.
Rethink Your Posting Schedule: Dive into your analytics to pinpoint when your audience is actually online and engaging. If your best-performing posts consistently go live on weekday mornings, it’s time to shift more of your schedule to that peak window.
Jump on Timely Trends: That same report showing engagement declines also pointed to a huge opportunity: holiday-themed posts. Across nearly every industry, posts with relevant holiday hashtags pulled in the highest engagement. This is a golden nugget of information you can plan your content calendar around for months.
Engaging with comments is another critical piece of the puzzle. It shows you're paying attention and can even give your posts an algorithmic boost. If you're running out of fresh ways to reply, a tool like a Facebook comment generator can offer a little inspiration to keep the conversations going.
Have Questions? We've Got Answers
Even with the best plan in place, it's natural for questions to come up as you dig into your social media performance. Getting clear answers is what turns good data into great strategy. Let's walk through some of the most common questions I hear from other marketers.
What's the Real Difference Between Metrics and KPIs?
This one trips people up all the time, but the distinction is actually pretty simple once you get it.
Think of metrics as raw data points. They're all the numbers you see in your analytics dashboards—likes, impressions, video views, clicks, you name it. They're the basic ingredients.
A Key Performance Indicator (KPI), on the other hand, is a metric you've hand-picked because it directly tells you if you're getting closer to a specific business goal. For example, "website clicks" is just a metric. But if your goal is to generate leads, your KPI might be the click-through rate on posts promoting a free guide. A KPI is a metric that has a job to do.
How Often Should I Actually Check and Report on My Performance?
There's no magic number here. The right reporting schedule really comes down to your goals, your team's workflow, and who needs to see the results. I've found a tiered approach works best for most businesses.
Weekly Check-ins: These are your quick, in-the-trenches reviews. They're perfect for keeping an eye on active campaigns, letting you make fast adjustments like tweaking ad copy or shifting budget to a post that's taking off.
Monthly Reports: This is the sweet spot for tracking broader trends and updating key stakeholders. A month gives you enough data to see patterns emerge without getting bogged down by daily noise.
Quarterly & Yearly Reviews: This is where you zoom out for big-picture thinking. Use these moments to review progress against your main business objectives, plan for the next quarter, and decide where to invest your time and money long-term.
My advice? Avoid the temptation to report on everything all the time. A short weekly email with a few key bullet points will get read and acted on. A massive spreadsheet that no one opens is just a waste of time.
What Are the Best Tools for Tracking Social Media Success?
You can build an incredibly effective measurement toolkit without a huge budget. The trick is to combine a few key tools to get the full picture—from what's happening on the platform to what's happening on your website.
Your first stop should always be the native analytics tools that each platform provides for free. They are packed with valuable information.
TikTok Analytics for getting into the weeds of your video performance.
X (Twitter) Analytics for keeping tabs on your tweet engagement.
To pull everything together, especially when you're managing several accounts, a third-party tool is a lifesaver. It saves you from the headache of hopping between a dozen different browser tabs.
And finally, Google Analytics 4 is absolutely essential. It's the only way to connect the dots and see how your social media work translates into actual website traffic, leads, and sales—the numbers that really prove your ROI.
Ready to bring your scheduling, analytics, and reporting together in one place? Postiz gives you all the tools you need to measure what matters and grow your business. Stop juggling tabs and start making smarter decisions with confidence. Get started with Postiz today!


![Top 11 YouTube Scheduling Tools [2024]](/_next/image?url=https%3A%2F%2Fcms.postiz.com%2Fwp-content%2Fuploads%2F2024%2F08%2FBlog-Post-23.png&w=1080&q=75)


