


Why Your Social Media Strategy Needs a Dashboard Command Center
Picture trying to navigate a busy city at rush hour without a map or a GPS. You might get where you're going, but the trip would be confusing, stressful, and probably involve a few wrong turns. Running a social media strategy without a social media analytics dashboard is a lot like that—you're working with guesswork and reacting to problems instead of seeing them coming. You’re essentially flying blind in a setting that requires a clear view.
A dashboard serves as your strategic command center. It takes all the jumbled streams of likes, comments, shares, and mentions and turns them into a clean, interactive map. Instead of just knowing a post did well, you can understand why. Was it the time you posted? The image you used? A specific hashtag? This is the kind of insight that separates casual social media use from professional, results-focused campaigns.
From Social Noise to Strategic Signals
Without one central place to look, social media data is just a lot of noise. Your team might spend hours jumping between different platforms, manually putting together spreadsheets that are already out of date by the time they're done. A dashboard brings all this information together, giving you a single source of truth. This helps you to:
- Track Performance in Real-Time: Immediately see which campaigns are connecting with your audience and which ones are not, allowing you to make quick adjustments.
- Understand Audience Behavior: Learn who your audience is, what they find interesting, and when they are most likely to be online.
- Monitor Brand Health: Keep an eye on how people feel about your brand, so you can catch potential PR problems before they grow.
To get the most out of your dashboard, it's also important to understand how a strong Shopify social media integration works. This connection can turn your engagement metrics into real sales figures, showing a direct link between your social media actions and your revenue.
The Growing Divide in a Data-Driven Market
Having a dashboard is no longer a nice-to-have; it's a must-have to stay competitive. Businesses that use a social media analytics dashboard effectively make smart, proactive choices. Those without one are left reacting to situations, which often leads to expensive mistakes. The market's incredible growth reflects this reliance on data. The global social media analytics market was valued at USD 10.23 billion in 2024 and is expected to jump to USD 43.25 billion by 2030. This growth highlights a basic change: data powers modern marketing, and a dashboard is the key that starts the engine. You can learn more about these market projections to see just how quickly this space is expanding.
Essential Dashboard Features That Actually Move the Needle
Stepping into the world of social media analytics dashboards can feel a bit like walking into a car dealership. Every model has a long list of features, but which ones will actually get you where you need to go, and which are just shiny extras? An effective social media analytics dashboard isn't about having the most widgets; it's about having the right tools that directly inform your strategy and guide your decisions. Not all features are created equal, and focusing on the ones that matter is how you get real value from your tool.
Core Capabilities for Strategic Insight
To start, any useful dashboard must master the fundamentals. These are the non-negotiable features that form the foundation of solid social media analysis. Without them, you're just looking at disconnected data points instead of uncovering a meaningful story. The goal is to see how different metrics work together to paint a complete picture of your performance.
This infographic shows the relationship between three core social media metrics, illustrating how one builds upon the other.
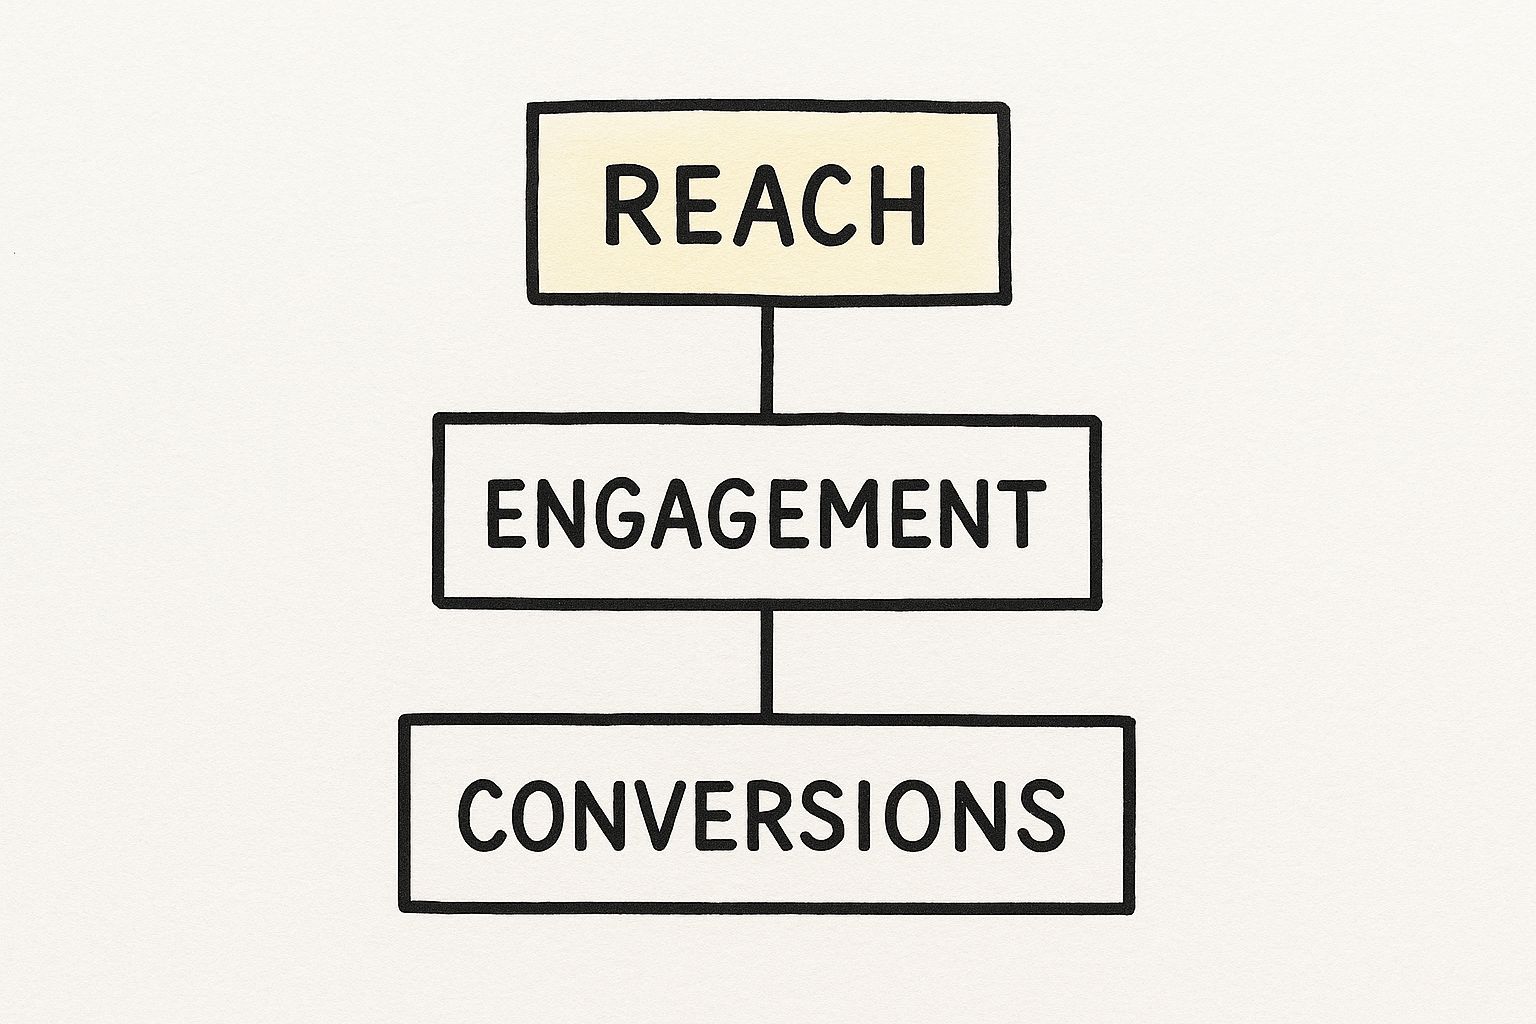
As the visualization shows, broad reach is the foundation. This reach funnels down to more focused engagement, which ultimately leads to the goal of conversions.
- Real-Time Monitoring: The ability to see conversations as they happen is critical. This isn't just for engaging with positive comments; it’s a vital tool for crisis management. Spotting a sudden increase in negative mentions allows your team to respond immediately, preventing a small issue from becoming a major brand reputation crisis.
- Comprehensive Reporting: Your dashboard must be able to generate clear, customizable reports. This goes beyond basic data exports. A great platform lets you build reports that tell a story, connecting social media KPIs to business goals for stakeholders who may not be social media experts. You can explore a variety of powerful social media reporting tools to see how they turn raw data into understandable narratives.
Advanced Features for a Competitive Edge
Once the basics are covered, advanced features can give you a significant advantage. This is where modern dashboards set themselves apart from simpler tools. The integration of artificial intelligence has greatly improved the depth of analysis possible. AI and machine learning have made features like sentiment analysis and predictive analytics more powerful, offering deeper insights into customer behavior. The growing importance of influencers has also spurred demand for specialized analytics. You can read the full research about this market trend to understand its impact.
These AI-supported features include:
- Sentiment Analysis: Moving beyond just counting mentions, this feature analyzes the emotion behind conversations. Is the chatter about your new product positive, negative, or neutral? This helps you measure public perception with a level of detail that manual review could never match.
- Competitive Intelligence: A top-tier dashboard lets you ethically monitor your competitors’ social performance. You can track their share of voice, see their top-performing content, and analyze their audience engagement strategies. This information is key for benchmarking your own efforts and spotting opportunities they might have missed.
To better understand how these features stack up, let's compare what you can expect from different levels of dashboards.
Essential Dashboard Features Comparison
A detailed comparison of core features across different types of social media analytics dashboards
| Feature | Basic Dashboard | Advanced Dashboard | Enterprise Dashboard |
|---|---|---|---|
| Real-Time Monitoring | Tracks mentions, hashtags, and keywords with some delay. | Live monitoring with instant alerts for keywords and mentions. | Continuous, real-time data streaming with complex alert systems and workflow integrations. |
| Reporting | Standard, pre-built report templates with limited customization. | Customizable reports with drag-and-drop builders and automated scheduling. | Fully customizable, white-label reports with API access for integration into business intelligence systems. |
| Sentiment Analysis | Basic positive/negative/neutral classification. | Nuanced sentiment tracking (e.g., joy, anger, surprise) with high accuracy. | AI-driven sentiment analysis that understands sarcasm and context, often including intent analysis (e.g., purchase intent). |
| Competitive Intelligence | Tracks a few competitors on basic metrics like follower growth. | In-depth analysis of multiple competitors, including share of voice, top content, and audience overlap. | Full competitive landscape analysis, including predictive insights, trend-spotting, and benchmarking against industry standards. |
| Data Sources | Covers major platforms like Facebook, Twitter, and Instagram. | Includes a wider range of sources like blogs, forums, and news sites. | Extensive data sources, including review sites, broadcast media, and premium data sets, with historical data access. |
As the table shows, while a basic dashboard can get you started, advanced and enterprise solutions provide the deeper insights needed for a truly data-driven strategy. The right choice depends on your team's size, goals, and budget.
How Smart Industries Use Social Analytics Dashboards
A powerful social media analytics dashboard isn’t a cookie-cutter tool. Its real value comes to life when it’s shaped to solve the unique problems and highlight the opportunities within a specific industry. For many sectors, it has become a critical tool for predicting what’s next and turning public conversation into a real business advantage. The uses go far beyond just counting likes and followers, offering key intelligence that directly shapes business operations.
From Risk Management to Customer Experience
Different industries turn social data into strategic assets in their own ways. The focus moves away from broad marketing metrics to specific, operational goals. Think of it like a specialized lens that brings different priorities into focus.
-
Retail and E-commerce: These businesses use dashboards to keep an eye on product feedback and spot new trends. By watching discussions around particular items or styles, they can better forecast demand, manage their stock, and find chances to create new product lines. A sudden jump in positive mentions for a certain dress on Instagram could signal the next big seller.
-
Hospitality: Hotels and travel companies check social conversations to understand traveler feelings and anticipate booking patterns. If a dashboard flags a rise in negative comments about cleanliness at one location, the management can act immediately before it harms online reviews and booking numbers. They also monitor chatter about travel destinations to create more appealing promotional deals.
The Financial Sector's Data-Driven Edge
Nowhere is the strategic power of social analytics more clear than in finance. The Banking, Financial Services, and Insurance (BFSI) sector is the largest global user of these tools. This is because dashboards are essential for risk management, customer service, and even spotting fraud. Banks monitor social sentiment for early warnings of threats to their reputation, while insurance companies track conversations to gauge customer satisfaction with the claims process. This deep dependence on data for high-stakes decisions shows just how powerful these tools can be. You can discover more insights about BFSI market share to understand its leading role.
In the end, smart industries set up their dashboards to answer their most important business questions. They go beyond simple reports to build a focused intelligence center that supports proactive decisions, protects the brand, and finds revenue opportunities hidden in the daily stream of social media conversation.
Turning Social Insights Into Revenue Growth
A social media analytics dashboard is much more than a simple counter for likes and shares. Its real power is in turning social data into real-world business results. This is where you see the return on your investment, as audience chatter becomes a source of measurable income. By looking past simple vanity metrics, smart companies use their dashboards to directly impact sales, guide product creation, and build customer loyalty.
From Segmentation to Sales
One of the clearest lines from social insight to revenue comes from smarter customer segmentation. Think of it this way: if you're a fitness brand, your dashboard might highlight a group of followers who always interact with your posts about plant-based nutrition. Instead of blasting them with generic gym promotions, you can create a highly focused campaign for your new vegan protein powder. This approach feels more personal to the customer and often results in much higher conversion rates.
This method is so effective that customer segmentation and targeting are now the most common applications for social analytics. Companies focus on it because personalized marketing just works better, creating engagement that translates into sales. You can read more about the market value of targeted strategies and how it’s shaping the industry.
Influencing Product Development
The honest, unfiltered conversations your audience has online are a treasure trove for product development. A social media analytics dashboard is like your own private listening station, picking up on real-time feedback that can define your next big launch. For example, a software company might see a growing number of users asking for a particular integration. By responding to this insight, they not only create a feature people genuinely want but also avoid the expensive mistake of building something nobody asked for. This customer-focused method turns social listening into a direct pipeline for innovation, boosting the chances of a successful product and improving customer lifetime value.
Creating Personalized Customer Experiences
Personalization isn't just a nice bonus anymore; it’s what sets brands apart. A good dashboard helps you map out individual customer journeys and understand their preferences. By keeping track of past interactions and sentiment, you can design experiences that make customers feel understood and appreciated. This could be as straightforward as offering a discount on an item they looked at before or as advanced as proactively solving a common issue before it turns into a complaint.
- Improved Conversion Rates: By reaching the right people with the right message at the right moment.
- Increased Customer Lifetime Value: By building loyalty through relevant and personal interactions.
- Expanded Market Share: By using insights to find and appeal to new audience groups.
In the end, these strategies demonstrate that a solid social media analytics dashboard isn't just for pulling reports. It's a key part of any successful business. When thoughtfully worked into a larger social media marketing plan, it connects your social media work directly to your company's financial success.
Cloud vs On-Premises: Making the Right Deployment Choice
Deciding how to set up your social media analytics dashboard is a major choice that influences everything from daily access to your budget down the line. It’s a bit like choosing between renting a fully furnished, managed office space (cloud) versus buying land and constructing your own building from scratch (on-premises). Each option has its own set of trade-offs, and understanding them is key to picking the right fit for your organization.
Cloud-Based Solutions: The Path of Accessibility and Scale
A cloud-based dashboard, also known as a SaaS (Software as a Service) solution, is hosted by the provider and accessed simply through your web browser. This is the most popular route for many businesses because it’s straightforward and quick to get started.
- Pros: Setup is incredibly fast since it doesn’t require you to have any internal IT hardware. All the maintenance, security patches, and server upkeep are managed by the vendor. This model typically comes with predictable subscription pricing and can easily grow with your team.
- Cons: You have less direct control over your data since it lives on third-party servers. Customization possibilities might also be more limited than with a self-hosted option.
For the majority of businesses, the sheer convenience and lower initial cost of a cloud solution make it the most practical choice. Platforms like Postiz offer a powerful, ready-to-use dashboard without the complexities of server management.
On-Premises Solutions: The Fortress of Control and Security
With an on-premises deployment, you install and operate the software on your own servers. This is like building that custom office—it demands more resources upfront but gives you ultimate authority over every aspect.
- Pros: You maintain complete ownership and control over your data, a non-negotiable for businesses in highly regulated sectors like finance or healthcare. It also allows for extensive customization to match your specific workflows.
- Cons: This route requires a substantial initial investment in server hardware. You'll also need a dedicated IT team to handle the installation, security, and continuous maintenance.
Hybrid Solutions: The Best of Both Worlds
A hybrid solution blends elements of both cloud and on-premises models. For instance, you could run the main application on your own servers to keep sensitive data secure, while using cloud services for less critical functions like reporting or data visualization.
- Pros: This approach offers a balanced mix of security and flexibility. You can keep your most critical data in-house while still benefiting from the scalability and ease of use of cloud features.
- Cons: Managing a hybrid environment can be complex, as it requires coordination between your internal IT team and the cloud provider. Integration can sometimes be a challenge.
To help you weigh these options, here’s a table that breaks down the key differences.
Deployment Options: Cloud vs On-Premises Comparison
Comprehensive comparison of cloud-based versus on-premises social media analytics dashboard deployments
| Factor | Cloud-Based | On-Premises | Hybrid Solution |
|---|---|---|---|
| Initial Cost | Low (subscription-based) | High (hardware, licenses) | Moderate (mix of both) |
| Data Control | Lower (data on vendor servers) | Maximum (data on-site) | High (sensitive data on-site) |
| Maintenance | Handled by vendor | Handled by internal IT team | Shared responsibility |
| Scalability | Easy (adjust subscription) | Difficult (requires hardware upgrades) | Flexible (scale cloud parts) |
| Setup Speed | Fast (minutes to hours) | Slow (weeks to months) | Moderate (depends on complexity) |
| Customization | Limited to vendor options | Highly customizable | Flexible but can be complex |
| Accessibility | Anywhere with an internet connection | Limited to your network (unless configured for remote access) | Flexible access options |
In summary, cloud solutions offer speed and convenience, making them ideal for most businesses. On-premises deployments provide unmatched security and control, which is essential for organizations with strict data policies. Hybrid models offer a middle ground, giving you a mix of both.
Industry analysis shows that while cloud deployment is rising in popularity for its agility, on-premises deployment currently holds the largest market share due to its superior data security and control. This is a top priority for companies facing strict compliance demands. You can read more about these deployment trends to understand their market impact. No matter which deployment you choose, you can improve your team's workflow by exploring social media automation tools that connect with your dashboard.
Building Your Dashboard Strategy That Actually Works
Picking a powerful social media analytics dashboard is just the starting point. The real challenge is making it a core part of your company's decision-making process. A good strategy is about more than just software; it’s about creating a culture where data guides your actions. Without this, your new tool can quickly become an expensive, unused gadget. The whole process starts with an honest look at what your business truly needs, not just what looks impressive in a report.
Define Your Key Performance Indicators (KPIs)
Before you even log into your new dashboard, you need to define what success looks like for your brand. Many teams get sidetracked by vanity metrics, like follower counts or total impressions. While these numbers offer some context, they don't reveal if your social media efforts are actually helping your business grow.
Your KPIs should be tied directly to real business goals. Think of it like a captain using specific stars to navigate. The right stars guide the ship to its destination, while the wrong ones lead you hopelessly off course.
- If your goal is sales, you should be tracking conversion rates from your social posts and the click-through rates on your product links.
- If your goal is brand loyalty, focus on monitoring sentiment trends and the engagement rate among your current customers.
- If your goal is market expansion, measure your share of voice and audience growth within new demographic groups.
This focus is what separates a dashboard that just shows data from one that provides clear, usable intelligence. As Warren Talbot, Marketing Manager at Vans, noted, getting support from leadership often requires "hard facts, data and ROI," a problem the right dashboard strategy can solve.
Overcoming Implementation Challenges
Even with the perfect KPIs, putting a new analytics dashboard into practice can hit some internal roadblocks. You might face resistance from team members who are comfortable with old methods, worries about data accuracy, or confusion about the new system. To get past these issues, you need to manage the change from the very beginning.
Start by explaining the "why" behind the new tool. Show your teams how the dashboard will make their jobs easier, not just add another task to their to-do list. For example, the Postiz dashboard brings content planning and performance analysis into one place, so you don't have to switch between different platforms.
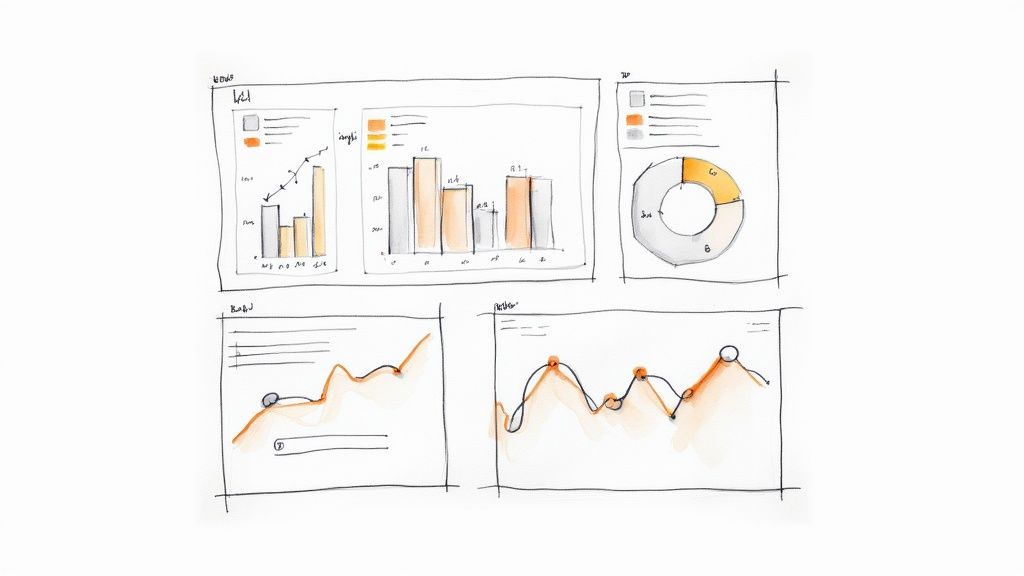
Here is an example of how the Postiz dashboard gives a clear overview of content performance across various social networks.
This single view helps teams quickly spot top-performing posts and see which channels are creating the most engagement. By offering hands-on training and setting clear rules—like who is responsible for which metrics—you can build a lasting process that turns insights into everyday actions. In the end, a successful dashboard strategy is built on people, processes, and a clear purpose, not just on technology.
Measuring Success and Maximizing Long-Term Value
The true test of a social media analytics dashboard isn't just the features it offers, but its power to deliver real, long-term results. It’s about moving beyond vanity metrics and turning raw data into a story of sustainable business growth. This means connecting your social media performance to outcomes that matter to the entire company, like happier customers and a healthier bottom line.
Think of your dashboard less like a rearview mirror showing you where you've been, and more like a periscope helping you spot what's ahead. This proactive approach—using data to see future trends before your competitors—is what builds a lasting advantage in the market. Success becomes a cycle of tracking, analyzing, and adapting.
Quantifying Your Impact
To truly show the value of your social media efforts, you need to focus on metrics that tell a story of growth and return on investment (ROI). This involves tracking how your performance evolves and using those insights to make smarter strategic moves.
Here are the key areas to measure:
- Improved Campaign Performance: Don't just report on metrics; show progress. Track how insights from your dashboard lead to a better cost-per-acquisition (CPA) or higher conversion rates over time. Draw a clear line from a specific analytical discovery to a more efficient campaign.
- Enhanced Customer Satisfaction: Use sentiment analysis to keep a finger on the pulse of your brand's reputation. A steady rise in positive comments or a drop in customer complaints is a powerful sign that your strategies are creating long-term value.
- Strategic Recommendations: The ultimate goal is to use data to inspire change. A great dashboard gives you the evidence needed to recommend new product features, identify untapped markets, or refine your customer service based on what your audience is actually saying.
To really maximize the long-term value from your social media, you have to be willing to go deep into your data. For platform-specific metrics, resources like a complete guide to data analysis can be incredibly useful. For example, you can review an Instagram Insights Explained: Your Complete Guide to Data Analysis to master the unique metrics of that platform.
By mastering the art of turning dashboard data into actionable recommendations, you stop being just a social media manager and become a driver of business strategy.
Ready to unlock the long-term value in your social data? The Postiz dashboard provides the powerful analytics and reporting tools you need to measure success, prove ROI, and make strategic decisions that fuel sustainable growth.


