When we talk about social media marketing metrics, we're really talking about the data that tells you if what you're doing is actually working. These aren't just numbers on a screen; they're the proof that your strategy is connecting with people and, more importantly, helping your business.
Think of it this way: metrics are what let you walk into a meeting and confidently explain why your budget should be approved or why your new campaign is a home run.
Manage all your social media in one place with Postiz
Let's be real for a second. Watching the like-counter go up feels great, but it doesn't directly translate into revenue. For too long, marketers have been stuck chasing numbers that look impressive on the surface but don't tell the whole story.
Imagine your social media strategy is a long road trip. Simple counts like likes and follows are just the odometer. Sure, it proves you've covered some ground, but it doesn't tell you if you're heading in the right direction or if you're about to run out of gas.
"Metrics show whether your content is doing more than just looking good—they reveal if it’s helping your business grow. But there’s no single 'magic' metric to measure. You must rely on a healthy mix of data points that reflect your brand, goals and strategy."
This is where we separate feel-good activity from real, measurable progress. Relying only on those surface-level numbers is like driving blindfolded and just hoping you end up somewhere worthwhile.
Distinguishing Vanity from Sanity Metrics
To build a strategy that truly delivers results, you have to know the difference between vanity metrics and what I like to call "sanity" metrics. Getting this right is a game-changer for anyone who needs to prove the value of their social media work.
Vanity Metrics: These are the numbers that are easy to see and easy to count—things like follower numbers, page likes, and post impressions. They can offer a quick glance at brand awareness, but they don't give you the "why" behind your performance. A post might rack up thousands of impressions, but if it generates zero clicks to your website, was it really a success?
Sanity Metrics: These are the numbers that tie your social media activity directly to your business goals. They answer the crucial "so what?" question and give you the solid data you need to make smart decisions.
Here are a few examples of sanity metrics you should be tracking:
Engagement Rate: This shows how many people are actually interacting with your content, which is a great indicator of how much it resonates with them.
Click-Through Rate (CTR): This measures how many people saw your post and were compelled enough to click a link.
Conversion Rate: This tracks how many of those clicks turned into a desired action, like a purchase, a download, or a sign-up.
Audience Sentiment: This gives you a sense of how people feel about your brand, adding crucial context that numbers alone can't provide.
Focusing on these deeper social media marketing metrics is like upgrading your car's dashboard. Instead of just an odometer, you now have a GPS, a fuel gauge, and an engine-health monitor. They tell you if you're on the fastest route to your destination, if you have enough fuel to get there, and if any part of your strategy needs a quick tune-up. This is how you drive real growth and build a brand that lasts.
How to Measure Brand Awareness and Reach
Before anyone can like, follow, or buy from you, they have to know you exist. It’s a simple truth, but it's the foundation of brand awareness. The first social media marketing metrics you need to master are the ones that tell you just how visible your brand is in a very crowded digital space.
Think of your social media as a digital storefront on a bustling street. You've put up your sign, but are people actually seeing it? This is where a couple of key metrics, Impressions and Reach, come in to give you a clear picture.
Awareness metrics are your brand's vital signs online. They tell you not just if you're speaking, but if anyone is actually in the room to hear you. Getting these right is the first real step to building a brand people recognize and trust.
Understanding these foundational numbers isn't just a "nice-to-have"—it's essential for building a social media strategy that actually works.
Reach vs. Impressions: What’s the Difference?
On the surface, Impressions and Reach look like they measure the same thing. They don't. Grasping the difference is crucial, otherwise you’re not getting the real story behind your content's performance.
Impressions: This is the total number of times your content was shown on a screen. If one person sees your post three separate times in their feed, that's three impressions. It’s a measure of total exposure.
Reach: This counts the unique people who saw your content at least once. If that same person sees your post three times, your reach for that person is still just one. This tells you the actual size of your audience.
So, while impressions tell you how often your content is being served up, reach tells you how many individuals you're actually getting in front of. You need both to understand the full scope of your visibility.
Measuring Your Share of the Conversation
It’s not enough to know how many people see your content; you also need to know how your brand’s voice stacks up against the competition. That’s where Share of Voice (SoV) comes in. This metric tells you what percentage of the conversation in your industry belongs to you.
Essentially, SoV calculates your brand mentions against the total mentions for you and your top competitors. A higher SoV means you’re a dominant voice in your space. To track this, you'll need social listening tools that can monitor brand mentions across the web. Sparking more conversations is a great way to boost mentions; for example, you can use a YouTube comment generator to get the ball rolling on your videos.
Consider the sheer scale of these platforms. As of early 2025, Facebook's advertising alone had the potential to reach 2.34 billion people. This massive audience highlights why tracking your visibility is so important. When you combine Reach, Impressions, and Share of Voice, you get a much clearer, more complete picture of just how aware people are of your brand.
Decoding Engagement to Understand Your Audience
If reach tells you how many people are in the room, engagement tells you if they’re actually listening. These are the metrics that show real, human interaction—think likes, comments, shares, and saves. They’re the heartbeat of your online community, giving you a clear picture of how well your content is actually connecting with people.
Imagine you're hosting a party. Impressions mean people showed up, which is great. But engagement means they're laughing, chatting, and really interacting with you and each other. A silent party is a red flag, and the same goes for social media. Low engagement is a sign that there's a disconnect between what you're posting and what your audience wants to see. This is how you turn a one-way broadcast into a real conversation.
That's why calculating your Engagement Rate is so much more powerful than just counting likes. It puts your interactions into context by measuring them against your audience size or reach. A post with 100 likes might not sound like much, but if it came from an account with only 1,000 followers, that's a fantastic 10% engagement rate.
The Hierarchy of Interactions
Let's be honest: not all engagement is created equal. While every interaction is a good thing, some require a lot more effort from your audience. This effort is a direct signal of how invested they are in your brand. Understanding this pecking order helps you focus your content strategy on what matters most.
Likes: These are the quick, easy nods of approval. A user sees your post, likes it, and moves on. Simple.
Comments: This is where it gets interesting. A comment takes thought and effort, opening the door for a real conversation and giving you priceless feedback.
Saves: When someone saves your post, it's a huge compliment. It means your content is so useful or inspiring that they're bookmarking it to come back to later.
Shares: This is the ultimate stamp of approval. A share means someone found your content so valuable that they put their own reputation on the line to show it to their friends and followers.
One single share can be worth more than a hundred likes because it puts your content in front of a whole new audience—and with a personal recommendation attached. When you're responding to these valuable interactions, you can even use tools like an https://postiz.com/tools/instagram-comment-generator to keep your replies fresh and engaging.
A high engagement rate is the sign of a healthy, thriving community. It shows your content isn't just being seen—it's being felt, discussed, and valued by the very people you want to reach.
Moving Beyond Basic Engagement Rates
To get an even sharper picture of your performance, you can drill down into more specific types of engagement. These advanced metrics help you understand the kind of reactions your content is sparking, which gives you a much clearer path forward.
Applause Rate
This metric isolates the "approval" actions—basically, likes. The Applause Rate tells you how many people gave your content a thumbs-up relative to your total number of followers. It’s a pure measure of positive affirmation. To find it, just divide your total likes by your total followers.
Amplification Rate
The Amplification Rate, on the other hand, measures how often your followers share your content. This is arguably one of the most critical social media marketing metrics for growth, because it shows how much your own audience is helping to spread the word. You calculate it by dividing the number of shares by your total follower count. A high amplification rate is proof that you're creating content that people genuinely want to share.
If you're looking to measure engagement on specific platforms beyond the usual suspects, you might find this guide on 8 Key Community Engagement Metrics for Telegram useful. By looking at these different layers of interaction, you can build a much more sophisticated understanding of what truly makes your audience tick.
3. Linking Social Metrics to Real Business Results
This is where everything comes together. It’s the point where all your social media activity—the posts, the comments, the likes—stops being just numbers on a screen and starts turning into tangible business outcomes. While building awareness and engagement is important, the real goal is to prove how those efforts are actually helping the bottom line.
This is where conversion metrics steal the show, giving you undeniable proof of your ROI.
Imagine your social media profile is a real-life retail store.
Reach is all the people who walk past your storefront.
Click-Through Rate (CTR) is the percentage of those people who decide to pop their heads in the door.
Conversion Rate is the final, most important step—it's the number of people who actually buy something.
When you get a handle on these conversion-focused social media marketing metrics, you can confidently show your boss or client that your work isn't just a "nice-to-have" but a powerful engine for generating real leads and revenue.
The Metrics That Truly Prove Your Worth
To connect your social media work to actual business results, you have to focus on metrics that track specific, valuable actions. These are the numbers that paint a clear picture of a customer's journey, from being a casual scroller to a loyal, paying customer.
Conversion Rate is the absolute king here. It measures the percentage of people who take a specific action you want them to after clicking a link in your post. This "action" can be whatever you define as valuable to your business, like:
Buying a product from your website.
Signing up for a newsletter or webinar.
Downloading an ebook or a guide.
Filling out a contact form to become a lead.
A high conversion rate is the clearest signal you can get that your social media content isn't just reaching the right audience, but it's also compelling enough to make them act.
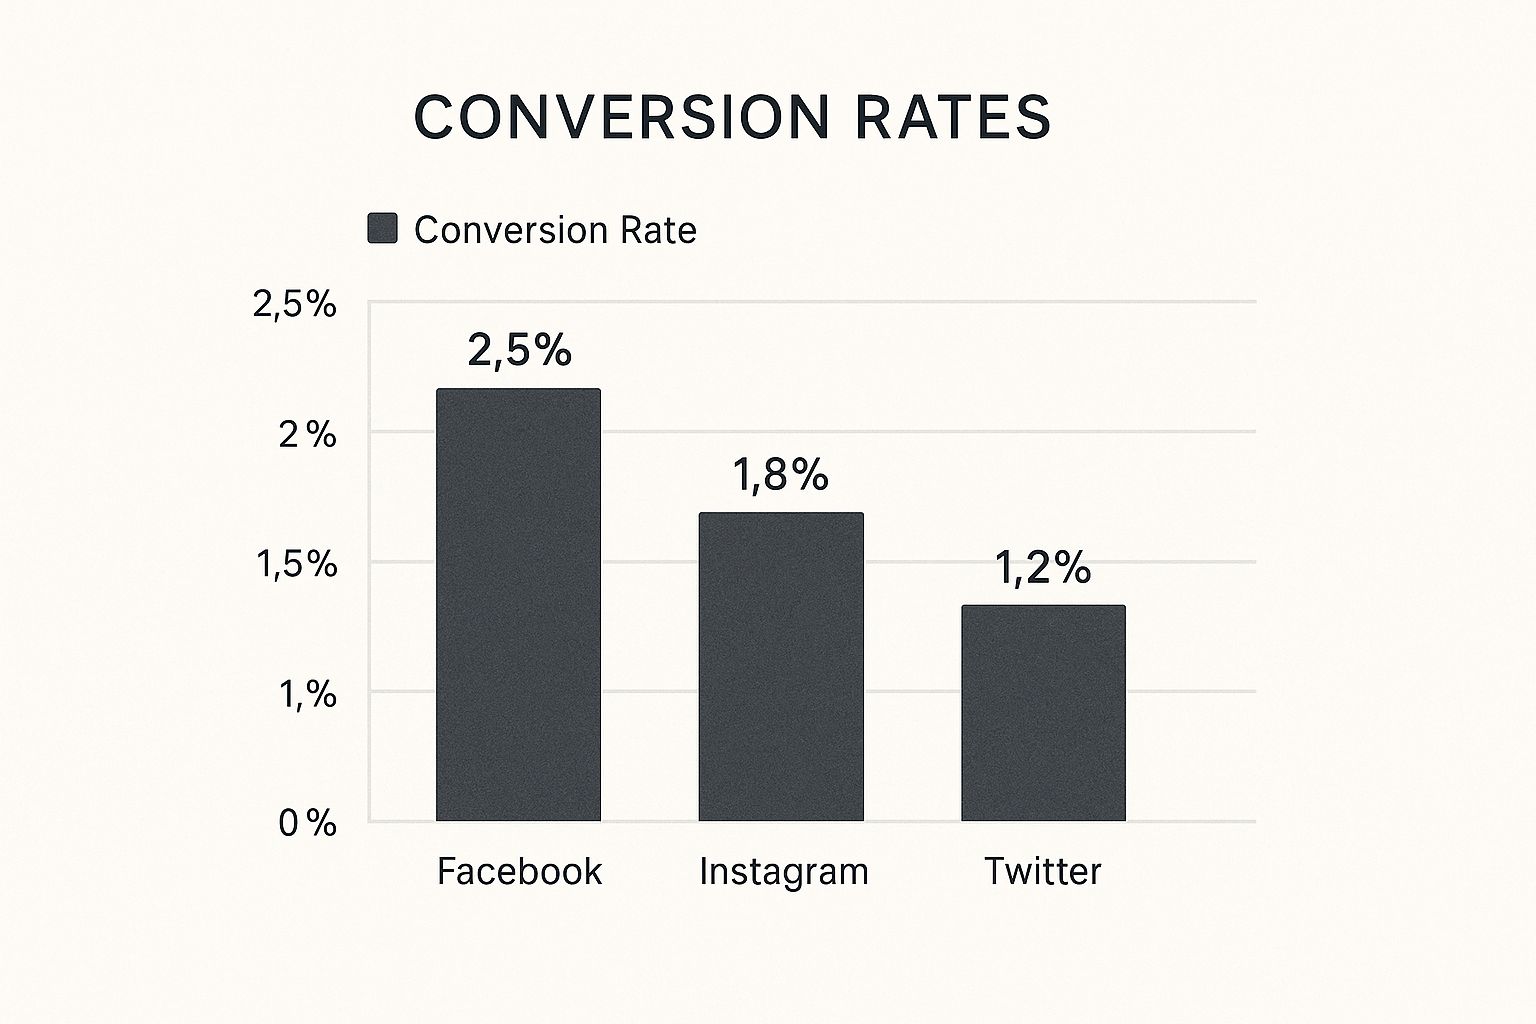
This image breaks down the average conversion rates you can expect across three of the biggest social platforms.
As you can see, performance varies quite a bit from one platform to another, which just goes to show why having a tailored strategy for each is so crucial.
Tracking Your Path to Conversion
To measure conversions properly, you need the right tools set up. Without them, you're just flying blind, guessing where your sales and leads are coming from. The two most essential tools for this job are UTM parameters and tracking pixels.
UTM (Urchin Tracking Module) parameters are small bits of code you tack onto the end of a URL. Think of them as little tracking tags that tell your analytics software exactly which social post or ad brought a visitor to your site. By using unique UTMs for different platforms and campaigns, you can see which channels are your true top performers.
A social media strategy without conversion tracking is like a business without a cash register. You might be busy, but you have no idea if you're actually making money. Tracking proves the value of every single post and campaign.
The Meta Pixel (for Facebook and Instagram) and the LinkedIn Insight Tag are small snippets of code you install on your website. These pixels are brilliant—they track what visitors do after they click on one of your social media ads, linking their website activity directly back to your campaigns. This is essential for measuring how effective your ads are and for calculating key metrics like Cost-Per-Conversion.
Understanding Platform-Specific Strengths
Not all social media platforms are built the same, especially when it comes to driving results. Each channel has its own unique strengths, and knowing these differences is key to optimizing your strategy and getting the most out of your ad budget.
Take a look at how different platforms stack up with some key benchmarks.
Platform-Specific Performance Benchmarks
This table highlights where each major platform shines, helping you see what to expect and where to focus your efforts.
Platform
Key Strength
Metric Benchmark
Facebook
High Click-Through Rates
2.53% average CTR for ads
Pinterest
High Return on Ad Spend
Often delivers 2x the ROAS of other platforms
LinkedIn
Driving B2B Purchase Intent
Ads can increase purchase intent by 33%
These numbers tell a story. Facebook ads are fantastic for getting people to click. Pinterest is a powerhouse for e-commerce returns. And for B2B marketers, LinkedIn is the go-to for building credibility and influencing purchase decisions.
Speaking of LinkedIn, a great way to build that professional credibility is by showcasing strong endorsements. If you want to beef up your profile, consider using a LinkedIn recommendation generator to help you get powerful testimonials that build trust.
By aligning your strategy with each platform’s unique strengths, you’ll build a much more efficient and effective social media machine.
Tracking Customer Loyalty and Advocacy
Getting someone to buy from you once is a great start. But turning that one-time customer into a genuine, loyal fan? That's priceless. Conversion metrics are great for tracking those initial wins, but loyalty and advocacy metrics tell a much bigger story about the long-term health of your brand. These are the numbers that prove your social media efforts are building real relationships, not just chasing quick transactions.
I like to think of it like a musician's career. A one-time conversion is like having a hit single—fantastic, for sure. But loyalty and advocacy? That's building a die-hard fan club that buys every album, wears the t-shirts, and drags all their friends to every concert. That's how you build something that lasts.
These specific social media marketing metrics show your knack for keeping customers around and inspiring them to become vocal supporters. It's no surprise that 65% of marketing leaders say they need to prove social media's value to get buy-in. Loyalty metrics are one of the most compelling ways to do just that.
Gauging How Happy Your Customers Are
Before you can build loyalty, you need a pulse on how your customers actually feel. Are they happy? Social media gives you a direct line to find out, cutting right through the noise.
One of the most straightforward ways to check in is with a Customer Satisfaction (CSAT) score. This is a simple measure of how happy someone is with a specific product, service, or interaction. You can easily collect this by running a quick poll on X or an Instagram Story, asking something like, "How would you rate your recent experience?"
Another key metric is the Net Promoter Score (NPS). While traditionally done over email, you can easily adapt it for social media by sending a private message after a customer interaction. NPS boils down to one powerful question: "On a scale of 0-10, how likely are you to recommend our brand to a friend?"
Tracking satisfaction isn't just about collecting good reviews; it's about identifying your biggest fans (promoters) and understanding the concerns of your critics (detractors). This feedback is gold for improving your customer experience and building stronger relationships.
By subtracting the percentage of detractors (scores 0-6) from your promoters (scores 9-10), you get a single, clear score that reflects your overall brand loyalty.
Identifying Your Brand Advocates in the Wild
True advocacy is what happens when customers are so thrilled with your brand that they talk about it on their own, without any prompting. These are authentic endorsements that carry far more weight than any paid ad. You absolutely need to be tracking them.
One of the clearest signs of advocacy is user-generated content (UGC). This is any content—photos, videos, reviews—created by your customers that features your brand. When a customer posts a picture using your product and tags you, they're essentially acting as a brand ambassador. Keep a close eye on your tags and relevant hashtags to catch this content.
You also need to track brand mentions. This metric counts every time your brand is mentioned on social media, even if your account isn't officially tagged. Social listening tools are fantastic for this, as they can pick up untagged mentions and even common misspellings. Every organic mention is a sign that your brand is part of the public conversation—a powerful indicator of genuine advocacy.
How to Build Your Metrics Dashboard
All the metrics in the world won't help you if they don't tell a clear story. The final, crucial step is pulling everything together into a dashboard that turns those raw numbers into real, usable insights.
Think of it as your command center. It's the one place you can go to see what’s working, what’s falling flat, and what you should do next. A great dashboard isn’t just about collecting data; it’s about making smarter decisions and showing your team or your boss exactly what your hard work is achieving.
Start with Your Business Goals
Before you even think about which metrics to track, you have to connect your dashboard to what the business actually cares about. This is where SMART goals (Specific, Measurable, Achievable, Relevant, Time-bound) come into play. It's not enough to say you want to "increase engagement."
A much better, more tangible goal would be: "Increase our Instagram engagement rate by 2% over the next quarter by focusing on video content." Now you have a clear target, a deadline, and a strategy.
Once you have your goals nailed down, choosing the right Key Performance Indicators (KPIs) becomes surprisingly simple. Every goal gets its own set of metrics.
Goal: Increase Brand Awareness
KPIs: Reach, Impressions, Share of Voice
Goal: Drive Website Traffic
KPIs: Click-Through Rate (CTR), Social Media Referral Traffic
Goal: Generate Leads
KPIs: Conversion Rate, Cost Per Lead (CPL)
Choosing the Right Dashboard Tools
With your goals and KPIs set, you need the right tools to bring it all to life. You don’t need an overly complicated or expensive setup to get started. The key is finding a platform that pulls your data together and makes it easy to understand at a glance.
A great dashboard doesn't just show you numbers; it shows you trends. It turns a static list of data points into a dynamic story of your performance over time, helping you spot opportunities and fix problems before they grow.
Here are a few options, from the free and simple to the more comprehensive:
Built-in Platform Analytics: Every social network has its own analytics panel. They're a great starting point, but you'll have to jump between platforms to get the full picture.
Google Analytics: A free and incredibly powerful tool for understanding how your social media efforts translate into website traffic and conversions.
Dedicated Social Media Platforms: Tools like our own Postiz, or others like Hootsuite and Sprout Social, offer all-in-one dashboards. These platforms combine scheduling, analytics, and reporting, which saves you a ton of time and gives you a complete view of all your social media marketing metrics.
Knowing the bigger picture is also important. With global social media ad spending projected to hit $276.7 billion in 2025, being able to prove your ROI is non-negotiable. Key benchmarks to keep in mind are an average ad CTR of 0.90% and a conversion rate of 9.21%. You can learn more about these social media statistics from Talkwalker. Building a dashboard helps you see exactly how your performance stacks up.
A Few Common Questions
Even with a solid grasp of social media metrics, some questions always pop up. Think of this as your go-to guide for those nagging uncertainties, designed to give you quick, clear answers so you can get back to analyzing your data with confidence.
How Often Should I Actually Check My Metrics?
There's no single "right" answer here—the best rhythm for checking your analytics really depends on what you're trying to achieve. But you can think of it in layers.
When you're running a paid campaign, especially one built around sales or leads, you need to be on top of it daily. Metrics like CTR and Cost Per Conversion are your best friends here. A daily check-in lets you tweak your ads and budget in real time, making sure you're not wasting money and are getting the best possible results.
For your day-to-day organic content, a weekly look is usually perfect. This is your chance to see how your reach, engagement rates, and follower growth are trending. It helps you understand what's connecting with your audience and what's falling flat, so you can adjust your content plan for the week ahead.
Finally, you need to zoom out. Once a month or every quarter, set aside time for a deep-dive analysis. This is where you connect the dots, spot long-term trends, calculate your overall ROI, and use that big-picture view to inform your strategy moving forward. It’s the perfect blend of being responsive and strategic.
What’s a Good Engagement Rate on Social Media, Anyway?
Ah, the million-dollar question. The honest answer? It depends. A "good" engagement rate is a moving target, and what's great for one account might be average for another. It all comes down to context.
Platform: People interact differently on LinkedIn than they do on TikTok. Each platform has its own unwritten rules and benchmarks.
Industry: A B2B software company is going to have a very different engagement landscape than a popular fast-fashion brand.
Audience Size: It's often easier for an account with 1,000 die-hard fans to get a high engagement rate than it is for a mega-brand with 10 million followers.
You'll often hear that a rate between 1% and 5% is a decent benchmark. But the number that truly matters is your own. The real goal is to see steady improvement over your own past performance. Are your numbers going up? That's what success looks like. Focus on that upward trend, not some arbitrary industry standard.
How Can I Actually Prove Social Media ROI?
Proving your Return on Investment (ROI) is all about drawing a straight line from your social media efforts to real business results. It’s about translating likes and shares into the language the C-suite speaks: dollars and cents.
First things first, you have to track everything meticulously. This means using UTM parameters in the links you share and setting up tracking pixels (like the Meta Pixel) on your website. This is what allows you to see exactly which sales, downloads, or sign-ups came directly from a specific post or ad.
Once you have that data, you can assign a dollar value to those conversions and plug it into a simple formula:
[ (Value Gained from Social Media – Total Investment) / Total Investment ] x 100
Remember, "Total Investment" isn't just your ad spend. It includes the cost of your social media tools, staff time, and any other related expenses. When you can present this kind of clear financial data next to metrics like Cost Per Acquisition (CPA), the value of what you do becomes impossible to ignore.
Which Metrics Matter More for B2B vs. B2C?
While both B2B and B2C businesses are on social media, they’re often playing completely different games. Their goals are different, so the metrics they care about most will be, too.
B2C (Business-to-Consumer) brands are usually focused on casting a wide net, building a vibrant community, and generating mass awareness. Their go-to metrics are often:
Reach and Impressions: How many eyeballs are seeing the brand?
Engagement Rate: Is our content resonating with our community?
Brand Mentions and UGC: Are people talking about us and creating their own content?
B2B (Business-to-Business) marketers, on the other hand, are typically more focused on lead generation, establishing expertise, and nurturing relationships. The most important social media marketing metrics for them tend to be:
Link Clicks that lead to valuable assets like whitepapers and case studies.
Lead Conversion Rate from things like webinar registrations or gated content downloads.
Share of Voice on key professional platforms like LinkedIn.
For B2B, the quality of a lead and its potential to move through a long sales cycle is almost always more important than the sheer volume of likes.
Ready to stop juggling spreadsheets and start making data-driven decisions? Postiz brings all your scheduling, analytics, and reporting into one intuitive dashboard. Unify your social media workflow, track the metrics that matter, and prove your impact with ease. Start your free trial of Postiz today!